# Technical Data Extraction: Conductance vs. Twisting Angle in $MoSe_2$ and $WSe_2$
This document provides a comprehensive extraction of data from two side-by-side line charts illustrating the relationship between twisting angle ($\theta$) and conductance ($G$) for two different materials.
## 1. General Metadata
* **Language:** English
* **Image Type:** Scientific Data Plots (Line charts with markers)
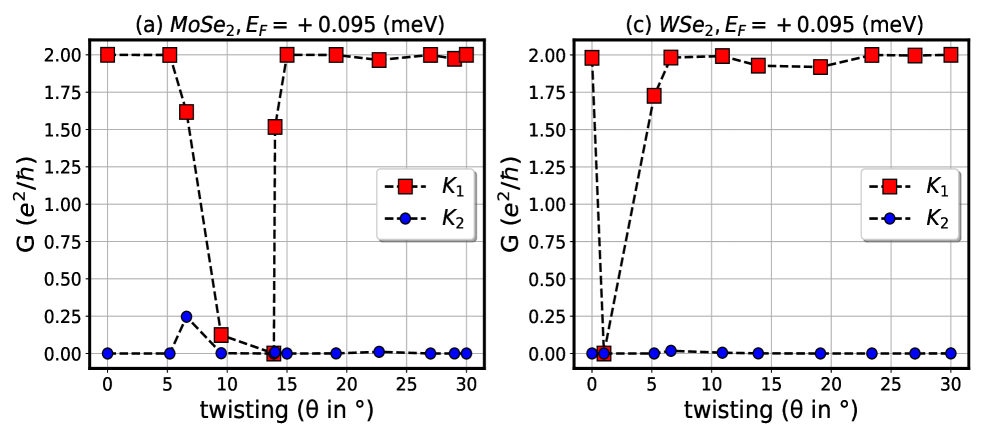
* **Common Y-Axis:** Conductance $G$ in units of $(e^2/h)$
* **Common X-Axis:** twisting ($\theta$ in $^\circ$)
* **Common Legend:**
* **Red Squares with dashed black line:** $K_1$
* **Blue Circles with dashed black line:** $K_2$
* **Legend Location:** Center-right of each plot.
---
## 2. Plot (a): $MoSe_2, E_F = +0.095$ (meV)
### Component Isolation: Header & Axes
* **Title:** (a) $MoSe_2, E_F = +0.095$ (meV)
* **Y-Axis Range:** 0.00 to 2.00 (increments of 0.25)
* **X-Axis Range:** 0 to 30 (increments of 5)
### Data Series Analysis
#### Series $K_1$ (Red Squares)
* **Trend:** Starts at a maximum value of 2.00. Remains stable until $\sim 5^\circ$, then drops sharply toward zero at $\sim 14^\circ$. It then recovers instantly back to 2.00 and remains stable through $30^\circ$.
* **Key Data Points (Approximate):**
| $\theta$ ($^\circ$) | $G$ ($e^2/h$) |
| :--- | :--- |
| 0 | 2.00 |
| 5 | 2.00 |
| 6.5 | 1.60 |
| 9.5 | 0.15 |
| 13.8 | 0.00 |
| 14 | 1.50 |
| 15 | 2.00 |
| 19 | 2.00 |
| 22.5 | 1.95 |
| 27 | 2.00 |
| 29 | 1.95 |
| 30 | 2.00 |
#### Series $K_2$ (Blue Circles)
* **Trend:** Remains consistently at or near 0.00 for the entire range, with a single small peak occurring between $5^\circ$ and $10^\circ$.
* **Key Data Points (Approximate):**
| $\theta$ ($^\circ$) | $G$ ($e^2/h$) |
| :--- | :--- |
| 0 | 0.00 |
| 5 | 0.00 |
| 6.5 | 0.25 |
| 9.5 | 0.00 |
| 14 | 0.00 |
| 30 | 0.00 |
---
## 3. Plot (c): $WSe_2, E_F = +0.095$ (meV)
### Component Isolation: Header & Axes
* **Title:** (c) $WSe_2, E_F = +0.095$ (meV)
* **Y-Axis Range:** 0.00 to 2.00 (increments of 0.25)
* **X-Axis Range:** 0 to 30 (increments of 5)
### Data Series Analysis
#### Series $K_1$ (Red Squares)
* **Trend:** Starts at 2.00, immediately drops to 0.00 at a very low angle ($\sim 1^\circ$), then recovers steadily back to 2.00 by $\sim 11^\circ$, remaining mostly stable at the maximum thereafter.
* **Key Data Points (Approximate):**
| $\theta$ ($^\circ$) | $G$ ($e^2/h$) |
| :--- | :--- |
| 0 | 2.00 |
| 1 | 0.00 |
| 5 | 1.75 |
| 6.5 | 1.98 |
| 11 | 2.00 |
| 14 | 1.95 |
| 19 | 1.95 |
| 23.5 | 2.00 |
| 27 | 2.00 |
| 30 | 2.00 |
#### Series $K_2$ (Blue Circles)
* **Trend:** Extremely stable. The value remains at 0.00 for the entire duration of the twisting angle from $0^\circ$ to $30^\circ$.
* **Key Data Points (Approximate):**
| $\theta$ ($^\circ$) | $G$ ($e^2/h$) |
| :--- | :--- |
| 0 | 0.00 |
| 1 | 0.00 |
| 30 | 0.00 |
---
## 4. Comparative Summary
* **Material Difference:** In $MoSe_2$, the $K_1$ conductance dip occurs at a much higher twisting angle ($\sim 14^\circ$) compared to $WSe_2$, where the dip occurs almost immediately ($\sim 1^\circ$).
* **$K_2$ Activity:** $MoSe_2$ shows a slight resonance/increase in $K_2$ conductance around $6.5^\circ$, whereas $WSe_2$ shows no $K_2$ activity across the measured spectrum.
* **Quantization:** Both materials exhibit quantized conductance behavior, primarily switching between $G=0$ and $G=2$ $(e^2/h)$ for the $K_1$ channel.