## Line Graphs: Computational Efficiency Metrics Across Model Configurations
### Overview
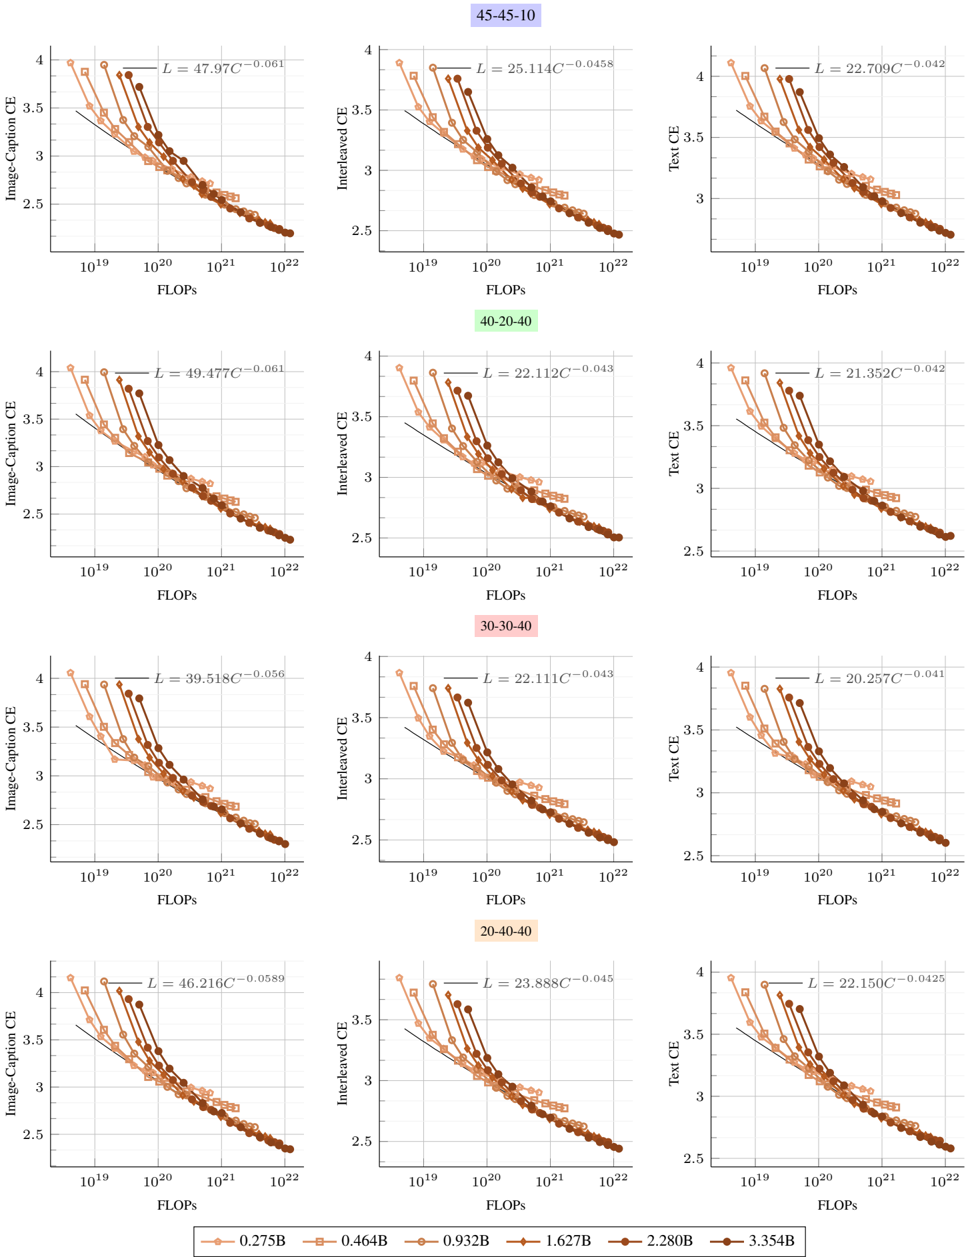
The image contains 12 line graphs arranged in a 4x3 grid, comparing computational efficiency metrics (CE) across different model sizes and configurations. Each row represents a distinct metric (Image-Caption CE, Interleave CE, Text CE), while columns show variations in model architecture or training parameters. All graphs plot CE against FLOPs (floating-point operations) on a logarithmic scale, with downward-trending lines indicating inverse relationships.
### Components/Axes
- **X-axis**: "FLOPs" (logarithmic scale: 10¹⁹ to 10²²)
- **Y-axis**:
- Top row: "Image-Caption CE"
- Middle row: "Interleave CE"
- Bottom row: "Text CE"
- **Legends**:
- Positioned at the bottom of each graph
- Colors correspond to model sizes (0.275B to 3.354B) and configurations (e.g., "45-45-10", "20-40-40")
- Example: Darkest red = 3.354B, lightest orange = 0.275B
### Detailed Analysis
1. **Image-Caption CE** (Top Row)
- **45-45-10**: L = 47.97C⁻⁰.⁰⁶¹ (dark red line)
- **40-20-40**: L = 49.477C⁻⁰.⁰⁶¹ (medium red)
- **30-30-40**: L = 39.518C⁻⁰.⁰⁵⁶ (light red)
- **20-40-40**: L = 46.216C⁻⁰.⁰⁵⁸⁹ (orange)
- All lines show steep declines, with larger models (3.354B) having the lowest CE at high FLOPs.
2. **Interleave CE** (Middle Row)
- **45-45-10**: L = 25.114C⁻⁰.⁰⁴⁵⁸ (dark red)
- **40-20-40**: L = 22.112C⁻⁰.⁰⁴³ (medium red)
- **30-30-40**: L = 21.352C⁻⁰.⁰⁴² (light red)
- **20-40-40**: L = 23.888C⁻⁰.⁰⁴⁵ (orange)
- Similar trends to Image-Caption CE, but with shallower slopes.
3. **Text CE** (Bottom Row)
- **45-45-10**: L = 22.150C⁻⁰.⁰⁴²⁵ (dark red)
- **40-20-40**: L = 20.257C⁻⁰.⁰⁴¹ (medium red)
- **30-30-40**: L = 21.352C⁻⁰.⁰⁴² (light red)
- **20-40-40**: L = 22.150C⁻⁰.⁰⁴²⁵ (orange)
- Text CE shows the least variability across configurations.
### Key Observations
- **Inverse Relationship**: All metrics show CE decreasing as FLOPs increase, with larger models (higher B values) having steeper declines.
- **Configuration Impact**:
- "45-45-10" configurations consistently show the highest CE across metrics.
- "20-40-40" configurations exhibit the lowest CE in Image-Caption and Interleave CE.
- **Error Bars**: Vertical error bars indicate measurement variability, with larger models showing wider spreads.
- **Exponential Decay**: Equations in legends confirm power-law relationships (e.g., C⁻⁰.⁰⁶¹), suggesting diminishing returns.
### Interpretation
The data demonstrates that computational efficiency degrades with increased FLOPs, particularly for larger models. This suggests architectural inefficiencies in scaling, where larger models require disproportionately more resources for marginal gains. The "45-45-10" configuration outperforms others across all metrics, implying optimal parameterization for efficiency. The Text CE metric's relative stability indicates text processing may be less sensitive to scaling challenges compared to image-caption or interleave tasks. These findings highlight trade-offs in model design: larger models achieve higher accuracy but at the cost of computational efficiency, necessitating careful optimization for deployment scenarios with resource constraints.