## Line Chart: Test AUROC vs. Temperature for Different Models
### Overview
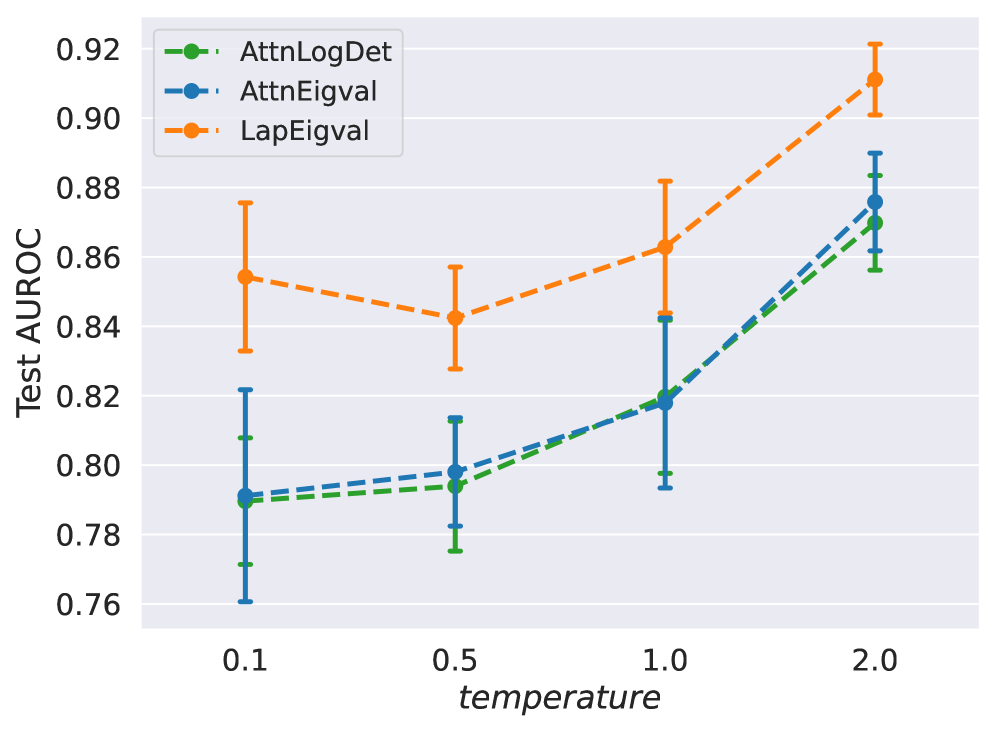
The image is a line chart comparing the performance of three different models (AttnLogDet, AttnEigval, and LapEigval) based on their Test AUROC scores at varying temperatures (0.1, 0.5, 1.0, and 2.0). The chart includes error bars indicating the variability in the AUROC scores.
### Components/Axes
* **Title:** Test AUROC
* **X-axis:** temperature, with values 0.1, 0.5, 1.0, and 2.0
* **Y-axis:** Test AUROC, ranging from 0.76 to 0.92 with increments of 0.02.
* **Legend (top-left):**
* AttnLogDet (Green, dashed line)
* AttnEigval (Blue, dashed line)
* LapEigval (Orange, dashed line)
### Detailed Analysis
* **AttnLogDet (Green, dashed line):**
* At temperature 0.1, Test AUROC is approximately 0.79 with an error range of +/- 0.02.
* At temperature 0.5, Test AUROC is approximately 0.79 with an error range of +/- 0.02.
* At temperature 1.0, Test AUROC is approximately 0.82 with an error range of +/- 0.02.
* At temperature 2.0, Test AUROC is approximately 0.87 with an error range of +/- 0.01.
* Trend: Generally increasing with temperature.
* **AttnEigval (Blue, dashed line):**
* At temperature 0.1, Test AUROC is approximately 0.79 with an error range of +/- 0.03.
* At temperature 0.5, Test AUROC is approximately 0.795 with an error range of +/- 0.02.
* At temperature 1.0, Test AUROC is approximately 0.82 with an error range of +/- 0.03.
* At temperature 2.0, Test AUROC is approximately 0.875 with an error range of +/- 0.015.
* Trend: Generally increasing with temperature.
* **LapEigval (Orange, dashed line):**
* At temperature 0.1, Test AUROC is approximately 0.855 with an error range of +/- 0.02.
* At temperature 0.5, Test AUROC is approximately 0.84 with an error range of +/- 0.015.
* At temperature 1.0, Test AUROC is approximately 0.86 with an error range of +/- 0.02.
* At temperature 2.0, Test AUROC is approximately 0.91 with an error range of +/- 0.01.
* Trend: Relatively stable between 0.1 and 0.5, then increases at 1.0 and 2.0.
### Key Observations
* AttnLogDet and AttnEigval perform similarly across all temperatures.
* LapEigval generally outperforms AttnLogDet and AttnEigval, especially at lower temperatures.
* All models show an increase in Test AUROC as the temperature increases from 1.0 to 2.0.
* The error bars indicate some variability in the performance of each model at each temperature.
### Interpretation
The chart suggests that increasing the temperature generally improves the performance of all three models, as measured by Test AUROC. LapEigval appears to be the best-performing model overall, particularly at lower temperatures. The error bars indicate that the performance of each model can vary, so these results should be interpreted with caution. Further analysis with more data points and statistical significance testing would be needed to draw more definitive conclusions.