\n
## Line Chart: Test AUROC vs. Temperature
### Overview
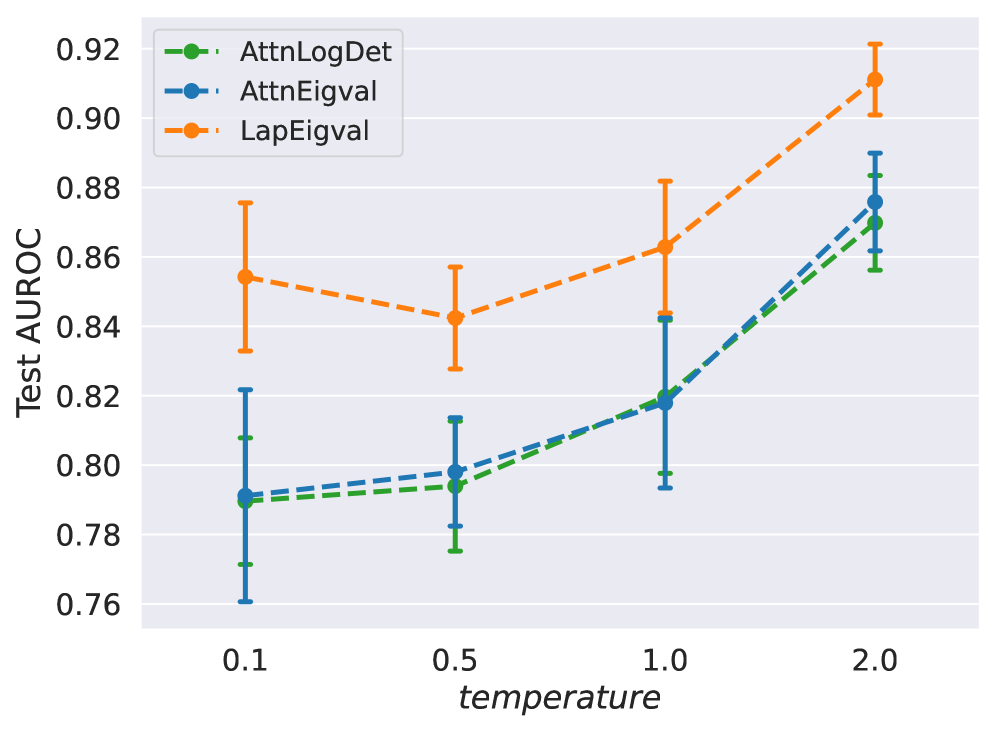
This line chart displays the relationship between "temperature" and "Test AUROC" for three different models: "AttnLogDet", "AttnEigval", and "LapEigval". Each data point represents the mean Test AUROC value at a given temperature, with error bars indicating the variability around that mean.
### Components/Axes
* **X-axis:** "temperature" with markers at 0.1, 0.5, 1.0, and 2.0.
* **Y-axis:** "Test AUROC" ranging from approximately 0.76 to 0.92.
* **Legend:** Located at the top-right corner of the chart.
* "AttnLogDet" - Green line with circular markers.
* "AttnEigval" - Blue line with circular markers.
* "LapEigval" - Orange dashed line with circular markers.
* **Error Bars:** Vertical lines extending above and below each data point, representing the standard deviation or confidence interval.
### Detailed Analysis
**AttnLogDet (Green Line):**
The green line shows an upward trend.
* At temperature 0.1, the Test AUROC is approximately 0.79 ± 0.03 (error bar extends from ~0.76 to ~0.82).
* At temperature 0.5, the Test AUROC is approximately 0.78 ± 0.02 (error bar extends from ~0.76 to ~0.80).
* At temperature 1.0, the Test AUROC is approximately 0.80 ± 0.02 (error bar extends from ~0.78 to ~0.82).
* At temperature 2.0, the Test AUROC is approximately 0.87 ± 0.02 (error bar extends from ~0.85 to ~0.89).
**AttnEigval (Blue Line):**
The blue line shows an upward trend.
* At temperature 0.1, the Test AUROC is approximately 0.81 ± 0.02 (error bar extends from ~0.79 to ~0.83).
* At temperature 0.5, the Test AUROC is approximately 0.80 ± 0.02 (error bar extends from ~0.78 to ~0.82).
* At temperature 1.0, the Test AUROC is approximately 0.82 ± 0.02 (error bar extends from ~0.80 to ~0.84).
* At temperature 2.0, the Test AUROC is approximately 0.88 ± 0.02 (error bar extends from ~0.86 to ~0.90).
**LapEigval (Orange Dashed Line):**
The orange dashed line shows a more complex trend, initially decreasing then increasing.
* At temperature 0.1, the Test AUROC is approximately 0.85 ± 0.03 (error bar extends from ~0.82 to ~0.88).
* At temperature 0.5, the Test AUROC is approximately 0.84 ± 0.03 (error bar extends from ~0.81 to ~0.87).
* At temperature 1.0, the Test AUROC is approximately 0.86 ± 0.03 (error bar extends from ~0.83 to ~0.89).
* At temperature 2.0, the Test AUROC is approximately 0.91 ± 0.03 (error bar extends from ~0.88 to ~0.94).
### Key Observations
* All three models show an increasing trend in Test AUROC as temperature increases.
* "LapEigval" starts with the highest Test AUROC at low temperatures (0.1 and 0.5) but is surpassed by "AttnEigval" and "AttnLogDet" at higher temperatures (2.0).
* The error bars suggest that the variability in Test AUROC is relatively consistent across temperatures for each model.
* "AttnLogDet" has the lowest Test AUROC values across all temperatures.
### Interpretation
The chart demonstrates the impact of "temperature" on the performance (measured by Test AUROC) of three different models. The increasing trend for all models suggests that higher temperatures generally lead to improved performance. However, the specific performance levels and the rate of improvement vary between models.
The "temperature" parameter likely controls a stochastic element within the models, such as the softmax function or a sampling process. Increasing the temperature introduces more randomness, which can help the models escape local optima and generalize better to unseen data, up to a certain point.
The initial higher performance of "LapEigval" at lower temperatures could indicate that it is less sensitive to the stochasticity introduced by temperature, or that it benefits from a more focused exploration of the solution space at lower temperatures. However, as the temperature increases, the benefits of the other models' increased exploration outweigh this advantage.
The error bars provide a measure of the robustness of each model's performance. The relatively small error bars suggest that the observed trends are statistically significant and not simply due to random fluctuations. Further investigation could explore the reasons for the differences in performance and variability between the models.