## Line Chart with Error Bars: Test AUROC vs. Temperature
### Overview
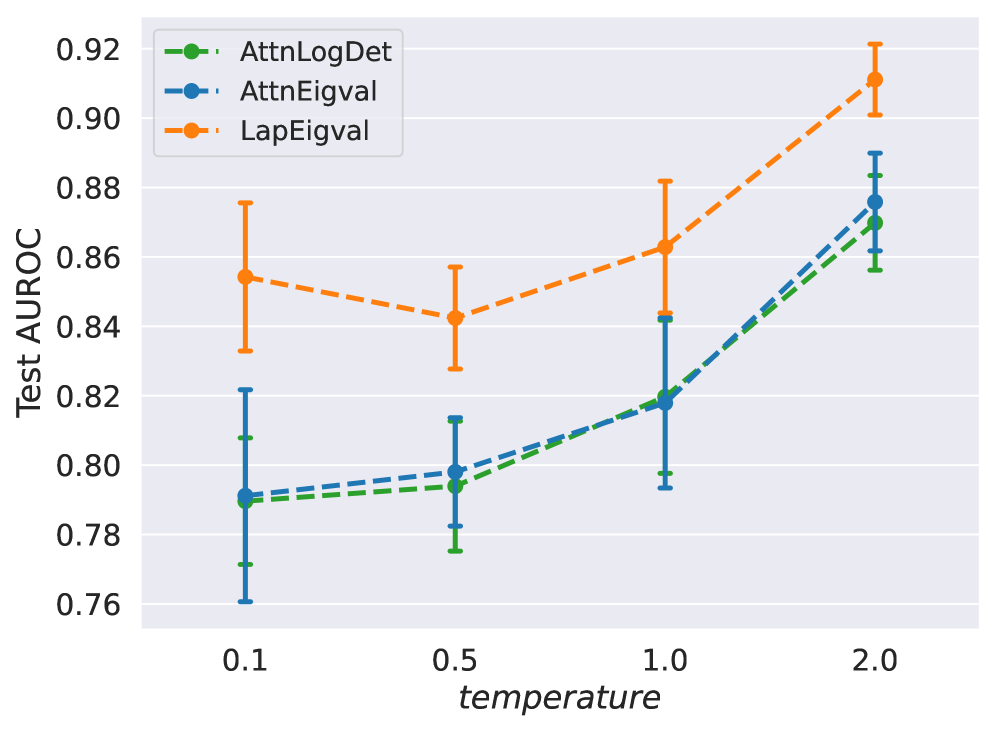
The image is a line chart displaying the performance of three different methods, measured by Test AUROC, as a function of a hyperparameter called "temperature." The chart includes error bars for each data point, indicating variability or confidence intervals. The overall trend shows that Test AUROC generally increases with temperature for all methods, with one method consistently outperforming the others.
### Components/Axes
* **Chart Type:** Line chart with markers and vertical error bars.
* **X-Axis:**
* **Label:** `temperature`
* **Scale:** Categorical/ordinal with discrete values: `0.1`, `0.5`, `1.0`, `2.0`.
* **Y-Axis:**
* **Label:** `Test AUROC`
* **Scale:** Linear, ranging from `0.76` to `0.92`, with major gridlines at intervals of `0.02`.
* **Legend:**
* **Position:** Top-left corner of the plot area.
* **Entries:**
1. `AttnLogDet` - Represented by a green dashed line with circular markers.
2. `AttnEigval` - Represented by a blue dashed line with circular markers.
3. `LapEigval` - Represented by an orange dashed line with circular markers.
* **Data Series:** Three distinct lines, each corresponding to a method in the legend. Each data point includes a central marker (mean/median value) and vertical error bars extending above and below.
### Detailed Analysis
**Data Series and Approximate Values:**
1. **AttnLogDet (Green Line):**
* **Trend:** Slopes gently upward from left to right.
* **Data Points (Approximate):**
* Temperature 0.1: AUROC ≈ 0.79 (Error bar range: ~0.77 to ~0.81)
* Temperature 0.5: AUROC ≈ 0.795 (Error bar range: ~0.78 to ~0.81)
* Temperature 1.0: AUROC ≈ 0.82 (Error bar range: ~0.80 to ~0.84)
* Temperature 2.0: AUROC ≈ 0.87 (Error bar range: ~0.86 to ~0.88)
2. **AttnEigval (Blue Line):**
* **Trend:** Slopes upward, closely following but slightly above the AttnLogDet line.
* **Data Points (Approximate):**
* Temperature 0.1: AUROC ≈ 0.79 (Error bar range: ~0.76 to ~0.82)
* Temperature 0.5: AUROC ≈ 0.80 (Error bar range: ~0.78 to ~0.81)
* Temperature 1.0: AUROC ≈ 0.82 (Error bar range: ~0.80 to ~0.84)
* Temperature 2.0: AUROC ≈ 0.88 (Error bar range: ~0.87 to ~0.89)
3. **LapEigval (Orange Line):**
* **Trend:** Starts high, dips slightly at temperature 0.5, then rises sharply. It maintains a significant performance gap above the other two methods across all temperatures.
* **Data Points (Approximate):**
* Temperature 0.1: AUROC ≈ 0.855 (Error bar range: ~0.83 to ~0.88)
* Temperature 0.5: AUROC ≈ 0.84 (Error bar range: ~0.83 to ~0.86)
* Temperature 1.0: AUROC ≈ 0.865 (Error bar range: ~0.84 to ~0.88)
* Temperature 2.0: AUROC ≈ 0.91 (Error bar range: ~0.90 to ~0.92)
### Key Observations
1. **Performance Hierarchy:** `LapEigval` (orange) consistently achieves the highest Test AUROC at every temperature point. `AttnEigval` (blue) and `AttnLogDet` (green) perform very similarly, with `AttnEigval` having a marginal advantage.
2. **Temperature Sensitivity:** All three methods show improved performance (higher AUROC) as the temperature increases from 0.5 to 2.0. The improvement is most dramatic for `LapEigval` between temperatures 1.0 and 2.0.
3. **Error Bar Patterns:** The error bars for `LapEigval` are generally larger, especially at lower temperatures (0.1 and 0.5), suggesting higher variance in its performance estimates under those conditions. The error bars for the two `Attn` methods are more consistent in size.
4. **Non-Monotonic Behavior:** The `LapEigval` series shows a slight decrease in mean AUROC when moving from temperature 0.1 to 0.5 before increasing again, which is a notable deviation from the otherwise upward trend.
### Interpretation
This chart likely compares different methods for estimating or utilizing eigenvalues (or related properties like log-determinants) of attention matrices (`Attn`) or Laplacian matrices (`Lap`) in a machine learning model, possibly for tasks like anomaly detection or out-of-distribution detection where AUROC is a common metric.
The data suggests that the `LapEigval` method is superior for this specific task, as measured by Test AUROC. Its performance advantage is substantial and grows with higher temperature settings. Temperature appears to be a beneficial hyperparameter for all methods, potentially by smoothing or scaling internal representations to improve discriminative power.
The larger error bars for `LapEigval` at low temperatures indicate that while its average performance is high, its results may be less stable or more sensitive to initial conditions or data subsets in that regime. The close performance of `AttnLogDet` and `AttnEigval` suggests that for attention-based features, the specific mathematical transformation (log-determinant vs. eigenvalue) may be less critical than the choice of using attention versus Laplacian features for this particular evaluation.
**Language Declaration:** All text in the image is in English.