## Chart: SER vs. Pilot Size
### Overview
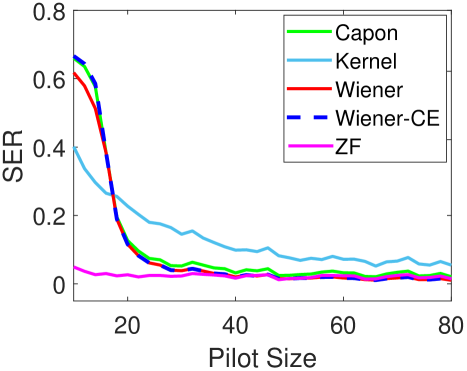
The image is a line chart comparing the Symbol Error Rate (SER) of five different algorithms (Capon, Kernel, Wiener, Wiener-CE, and ZF) as a function of Pilot Size. The x-axis represents the Pilot Size, ranging from approximately 0 to 80. The y-axis represents the SER, ranging from 0 to 0.8.
### Components/Axes
* **X-axis:** Pilot Size, ranging from 0 to 80, with tick marks at 20, 40, 60, and 80.
* **Y-axis:** SER (Symbol Error Rate), ranging from 0 to 0.8, with tick marks at 0, 0.2, 0.4, 0.6, and 0.8.
* **Legend:** Located in the top-right corner, it identifies the algorithms by color:
* Green: Capon
* Light Blue: Kernel
* Red: Wiener
* Dashed Dark Blue: Wiener-CE
* Magenta: ZF
### Detailed Analysis
* **Capon (Green):** The SER starts at approximately 0.6 at a Pilot Size of around 10, rapidly decreases to approximately 0.05 by a Pilot Size of 20, and then remains relatively constant around 0.05 for Pilot Sizes greater than 20.
* **Kernel (Light Blue):** The SER starts at approximately 0.4 at a Pilot Size of around 10, decreases to approximately 0.15 by a Pilot Size of 40, and then remains relatively constant around 0.15 for Pilot Sizes greater than 40.
* **Wiener (Red):** The SER starts at approximately 0.6 at a Pilot Size of around 10, rapidly decreases to approximately 0.05 by a Pilot Size of 20, and then remains relatively constant around 0.03 for Pilot Sizes greater than 20.
* **Wiener-CE (Dashed Dark Blue):** The SER starts at approximately 0.65 at a Pilot Size of around 10, rapidly decreases to approximately 0.05 by a Pilot Size of 20, and then remains relatively constant around 0.03 for Pilot Sizes greater than 20.
* **ZF (Magenta):** The SER starts at approximately 0.08 at a Pilot Size of around 10, and then remains relatively constant around 0.03 for Pilot Sizes greater than 10.
### Key Observations
* The Wiener-CE algorithm has the lowest SER for Pilot Sizes greater than 20.
* The Kernel algorithm has the highest SER for Pilot Sizes greater than 40.
* The Capon, Wiener, and Wiener-CE algorithms have similar performance for Pilot Sizes greater than 20.
* The ZF algorithm has a relatively low SER across all Pilot Sizes.
* All algorithms show a significant decrease in SER as the Pilot Size increases from 10 to 20.
### Interpretation
The chart demonstrates the relationship between Pilot Size and Symbol Error Rate for different algorithms. The data suggests that increasing the Pilot Size generally reduces the SER, but the improvement diminishes beyond a Pilot Size of 20. The Wiener-CE algorithm appears to be the most effective in minimizing SER, while the Kernel algorithm performs the worst. The ZF algorithm provides a consistently low SER, regardless of Pilot Size. These findings are important for optimizing communication systems by selecting the appropriate algorithm and Pilot Size to achieve the desired SER performance.