# Technical Data Extraction: SER vs. Pilot Size Performance Chart
## 1. Document Overview
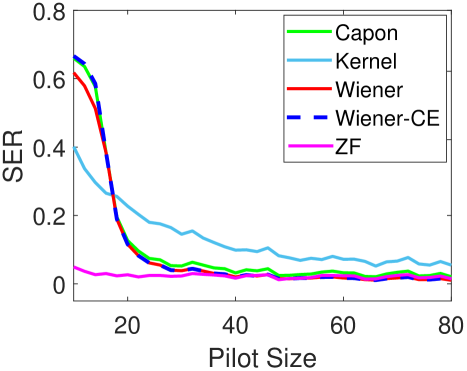
This image is a line graph illustrating the relationship between **Pilot Size** (independent variable) and **SER** (Symbol Error Rate, dependent variable) for five different signal processing or channel estimation algorithms.
## 2. Component Isolation
### A. Header/Metadata
* **Language:** English
* **Type:** 2D Line Plot
### B. Axis Definitions
* **Y-Axis (Vertical):**
* **Label:** `SER` (Symbol Error Rate)
* **Scale:** Linear, ranging from `0` to `0.8`.
* **Major Tick Markers:** `0`, `0.2`, `0.4`, `0.6`, `0.8`.
* **X-Axis (Horizontal):**
* **Label:** `Pilot Size`
* **Scale:** Linear, ranging from approximately `10` to `80`.
* **Major Tick Markers:** `20`, `40`, `60`, `80`.
### C. Legend (Spatial Grounding: Top-Right Quadrant)
The legend is contained within a black-bordered box.
* **Capon:** Solid Green line.
* **Kernel:** Solid Light Blue line.
* **Wiener:** Solid Red line.
* **Wiener-CE:** Dashed Dark Blue line.
* **ZF:** Solid Magenta (Pink) line.
---
## 3. Data Series Analysis and Trend Verification
### ZF (Solid Magenta Line)
* **Trend:** This line remains consistently low and nearly flat across the entire x-axis range. It represents the best performance (lowest error) at low pilot sizes.
* **Data Points:** Starts at ~0.05 (Pilot Size 10) and fluctuates slightly between 0.01 and 0.03 as Pilot Size increases to 80.
### Kernel (Solid Light Blue Line)
* **Trend:** Slopes downward moderately. It starts with a high error rate that gradually improves as Pilot Size increases, but it remains significantly higher than all other methods for Pilot Sizes > 20.
* **Data Points:** Starts at ~0.4 (Pilot Size 10), drops to ~0.2 at Pilot Size 25, and levels off around 0.05–0.10 by Pilot Size 80.
### Capon (Solid Green Line)
* **Trend:** Sharp exponential decay. Very high error at low pilot sizes, dropping rapidly to converge with the Wiener methods.
* **Data Points:** Starts at ~0.65 (Pilot Size 10), drops sharply to ~0.1 by Pilot Size 20, and stabilizes near 0.02 for Pilot Sizes > 40.
### Wiener (Solid Red Line)
* **Trend:** Sharp exponential decay, very similar to Capon but starting slightly lower.
* **Data Points:** Starts at ~0.6 (Pilot Size 10), drops sharply to ~0.1 by Pilot Size 20, and stabilizes near 0.01–0.02 for Pilot Sizes > 40.
### Wiener-CE (Dashed Dark Blue Line)
* **Trend:** Sharp exponential decay. This line is almost perfectly overlaid with the Capon and Wiener lines, indicating nearly identical performance at higher pilot sizes.
* **Data Points:** Starts at ~0.65 (Pilot Size 10), drops sharply to ~0.1 by Pilot Size 20, and stabilizes near 0.01–0.02 for Pilot Sizes > 40.
---
## 4. Key Findings and Observations
1. **Convergence:** For a Pilot Size greater than 40, the **Capon**, **Wiener**, **Wiener-CE**, and **ZF** methods all converge to a very low SER (near zero).
2. **Low Pilot Size Performance:** The **ZF** (Zero Forcing) method is the most robust when the Pilot Size is small (< 20), maintaining a low SER while all other methods exhibit high error rates.
3. **Underperformance:** The **Kernel** method consistently shows the highest SER once the Pilot Size exceeds 20, failing to converge as efficiently as the other four methods.
4. **Critical Threshold:** There is a significant performance "knee" or threshold around **Pilot Size 20**. Below this value, most methods (except ZF) fail significantly; above this value, they improve rapidly.