\n
## Diagram: State Transition Illustration
### Overview
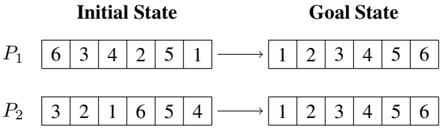
The image depicts a diagram illustrating the transition from an "Initial State" to a "Goal State" for two problems, labeled P1 and P2. Each problem is represented by a sequence of six numbered boxes, showing the arrangement of numbers within each state. An arrow indicates the transformation from the initial to the goal state.
### Components/Axes
The diagram is divided into two columns labeled "Initial State" and "Goal State". Each column contains two rows, labeled P1 and P2. Each row represents a problem instance. Within each row, there are six boxes representing the state of the problem. The boxes contain numerical values from 1 to 6. Arrows point from the initial state to the goal state.
### Detailed Analysis or Content Details
**Problem P1:**
* **Initial State:** The sequence of numbers is 6, 3, 4, 2, 5, 1.
* **Goal State:** The sequence of numbers is 1, 2, 3, 4, 5, 6.
**Problem P2:**
* **Initial State:** The sequence of numbers is 3, 2, 1, 6, 5, 4.
* **Goal State:** The sequence of numbers is 1, 2, 3, 4, 5, 6.
### Key Observations
Both problems (P1 and P2) share the same "Goal State" – a sequence of numbers arranged in ascending order from 1 to 6. The "Initial States" for both problems are different, representing different starting configurations. The diagram illustrates a transformation or a series of steps required to move from the initial disordered state to the final ordered state.
### Interpretation
This diagram likely represents a problem-solving scenario, potentially in the context of algorithms or search strategies. The "Initial State" represents the starting point of a problem, and the "Goal State" represents the desired solution. The arrow suggests a process or algorithm that transforms the initial state into the goal state. The fact that both problems converge to the same goal state suggests that the goal is well-defined and independent of the initial configuration. This could be a puzzle, a sorting problem, or a state-space search problem. The diagram doesn't provide information about *how* the transformation is achieved, only that it is possible. It is a visual representation of a before-and-after scenario.