## Bayesian Network Diagram: Night, Sleep, and Light
### Overview
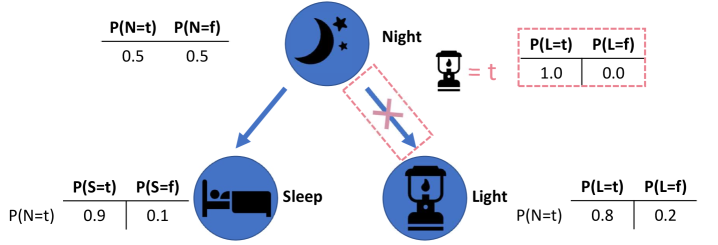
The image depicts a Bayesian network diagram illustrating the probabilistic relationships between three variables: Night, Sleep, and Light. The diagram includes nodes representing these variables, directed edges indicating dependencies, and conditional probability tables quantifying the relationships.
### Components/Axes
* **Nodes:**
* **Night:** Represented by a blue circle containing a moon and stars icon. Labeled "Night" to the right of the circle.
* **Sleep:** Represented by a blue circle containing a bed icon. Labeled "Sleep" below the circle.
* **Light:** Represented by a blue circle containing a lantern icon. Labeled "Light" to the right of the circle.
* **Edges:**
* A directed edge (arrow) points from the "Night" node to the "Sleep" node.
* A directed edge (arrow) points from the "Night" node to the "Light" node, but this edge is crossed out with a pink "X" inside a dashed pink rectangle.
* **Conditional Probability Tables:**
* **Night:** A table above the "Night" node shows the prior probabilities: P(N=t) = 0.5 and P(N=f) = 0.5.
* **Sleep:** A table below the "Sleep" node shows the conditional probabilities: P(S=t | N=t) = 0.9 and P(S=f | N=t) = 0.1.
* **Light:** A table below the "Light" node shows the conditional probabilities: P(L=t | N=t) = 0.8 and P(L=f | N=t) = 0.2.
* A table to the right of the "Night" node shows the conditional probabilities: P(L=t) = 1.0 and P(L=f) = 0.0, with "Lantern = t" to the left of the table.
### Detailed Analysis
* **Night Node:**
* P(N=t) = 0.5: The probability of it being night (N=t) is 0.5.
* P(N=f) = 0.5: The probability of it not being night (N=f) is 0.5.
* **Sleep Node:**
* P(S=t | N=t) = 0.9: Given that it is night (N=t), the probability of someone sleeping (S=t) is 0.9.
* P(S=f | N=t) = 0.1: Given that it is night (N=t), the probability of someone not sleeping (S=f) is 0.1.
* **Light Node:**
* P(L=t | N=t) = 0.8: Given that it is night (N=t), the probability of the light being on (L=t) is 0.8.
* P(L=f | N=t) = 0.2: Given that it is night (N=t), the probability of the light being off (L=f) is 0.2.
* **Light Node (Alternative):**
* P(L=t) = 1.0: The probability of the light being on (L=t) is 1.0.
* P(L=f) = 0.0: The probability of the light being off (L=f) is 0.0. This is only true when the lantern is true.
### Key Observations
* The "Night" node influences both the "Sleep" and "Light" nodes.
* The edge between "Night" and "Light" is crossed out, suggesting that the light is on regardless of whether it is night or not.
* The probability of sleeping is high (0.9) when it is night.
* The probability of the light being on is high (0.8) when it is night, but the alternative probability is 1.0 when the lantern is true.
### Interpretation
The diagram represents a simplified model of the relationships between night, sleep, and light. The crossed-out edge and the alternative probabilities for the "Light" node indicate that the light is on regardless of whether it is night or not. This could represent a scenario where the light is controlled by an external factor, such as a switch, and is always on. The high probability of sleeping when it is night suggests a strong correlation between these two variables. The diagram demonstrates how Bayesian networks can be used to model probabilistic dependencies between variables and make inferences based on observed data.