## Diagram: Bayesian Network with Conditional Probability Tables
### Overview
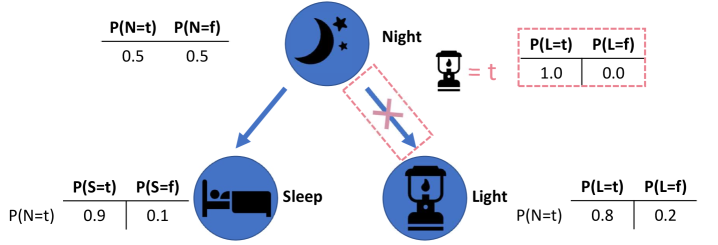
The image displays a probabilistic graphical model, specifically a Bayesian network, illustrating the relationships between three binary variables: **Night (N)**, **Sleep (S)**, and **Light (L)**. The diagram includes nodes, directed edges representing dependencies, and associated conditional probability tables (CPTs). An observation is indicated for the "Light" variable.
### Components/Axes
1. **Nodes (Variables):**
* **Night (N):** Top-center node. Icon: Crescent moon and stars.
* **Sleep (S):** Bottom-left node. Icon: Person in bed.
* **Light (L):** Bottom-right node. Icon: Table lamp.
2. **Edges (Dependencies):**
* A **solid blue arrow** points from **Night** to **Sleep**, indicating a direct probabilistic dependence.
* A **dashed blue arrow** with a **red cross (X)** over it points from **Night** to **Light**. This typically signifies a direct dependency that is being considered, blocked, or is the subject of analysis (e.g., in the context of d-separation or when evidence is observed).
3. **Observation Notation:**
* To the right of the **Night** node, an hourglass icon is shown with the text **`= t`**. This symbolizes that the variable **Light (L)** is **observed to be true (t)**. This observation is linked to the Light node via the dashed arrow.
4. **Probability Tables:**
* **Prior for Night:** Located top-left.
* `P(N=t) = 0.5`
* `P(N=f) = 0.5`
* **Conditional Probability for Sleep (given N=t):** Located bottom-left, next to the Sleep node.
* `P(S=t | N=t) = 0.9`
* `P(S=f | N=t) = 0.1`
* **Conditional Probability for Light (given N=t):** Located bottom-right, next to the Light node.
* `P(L=t | N=t) = 0.8`
* `P(L=f | N=t) = 0.2`
* **Probability for Light (Observed):** Located top-right, enclosed in a **red dashed border**.
* `P(L=t) = 1.0`
* `P(L=f) = 0.0`
* This table represents the state of knowledge after observing that `L = t`.
### Detailed Analysis
* **Network Structure:** The core structure is `N -> S` and `N -> L`. The dashed, crossed arrow from N to L, combined with the observation `L=t`, suggests the diagram is illustrating a scenario where the direct link between Night and Light is being evaluated in the presence of evidence.
* **Probability Values:**
* The prior probability of Night being true is uniform (0.5).
* If it is Night (`N=t`), there is a high probability (0.9) of Sleep (`S=t`).
* If it is Night (`N=t`), there is a moderately high probability (0.8) of the Light being on (`L=t`).
* The observation `L=t` is treated as a certainty (`P(L=t)=1.0`), which would be used to update beliefs about other variables in the network (e.g., calculating `P(N=t | L=t)`).
### Key Observations
1. **Evidence Instantiation:** The key feature is the **observed state of Light (`L=t`)**, highlighted by the red-dashed table and the `= t` notation. This turns the Light node into an evidence variable.
2. **Blocked Path Symbolism:** The red cross over the dashed arrow from Night to Light is a critical visual cue. In the context of the observed evidence `L=t`, this likely represents that the direct causal path from N to L is **"blocked" or "explained away"** when we condition on the effect (L). This is a common concept in Bayesian networks for explaining phenomena like the "explaining away" effect or in d-separation.
3. **Layout:** The legend/tables are spatially grounded next to their corresponding nodes. The observation notation is placed between the Night and Light nodes, visually associating the evidence with the Light variable.
### Interpretation
This diagram is a pedagogical tool for explaining **probabilistic inference in Bayesian networks**, specifically focusing on the impact of **observed evidence**.
* **What it Demonstrates:** It shows how observing an effect (Light is on, `L=t`) changes the probabilistic landscape. The crossed arrow suggests that once we know `L=t`, the direct influence of Night on Light is no longer relevant for inference; instead, we use the evidence to reason *backwards* about the cause (Night). For example, one would compute the posterior probability `P(N=t | L=t)` using Bayes' rule, which would be higher than the prior `P(N=t)=0.5` because `P(L=t | N=t)=0.8` is high.
* **Relationships:** The solid arrow `N->S` remains active. The state of Night still directly influences Sleep. The diagram sets up a scenario to explore how evidence on one branch (Light) might affect beliefs about a common cause (Night) and, by extension, other effects (Sleep) that are not directly connected to the evidence.
* **Notable Anomaly/Concept:** The primary "anomaly" is the **crossed-out arrow**. This is not a data anomaly but a conceptual notation. It visually encodes a key principle: in a Bayesian network, when you condition on a node (observe it), it can block the flow of information between its ancestors and other descendants. The diagram is likely part of a lesson on **d-separation** or **explaining away**, where observing `L=t` makes `N` and other causes of `L` (if there were any) dependent in a way that "explains" the observation.