## Matrix Grid with Colored Numerical Values
### Overview
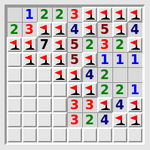
The image displays a 10x10 grid (matrix) where each cell contains a single-digit integer (1-5) or is empty. The numbers are colored in four distinct colors: red, green, blue, and black. There are no explicit axis labels, titles, or a legend provided within the image itself. The grid lines are light gray.
### Components/Axes
* **Grid Structure:** A 10-row by 10-column matrix.
* **Cell Content:** Each cell contains either a number (1, 2, 3, 4, or 5) or is blank.
* **Color Coding:** Numbers appear in four colors:
* Red
* Green
* Blue
* Black
* **Spatial Layout:** The colored numbers are not uniformly distributed. There is a higher concentration of numbers in the top-left quadrant and a distinct cluster in the bottom-right quadrant. The central and bottom-left areas have more empty cells.
### Detailed Analysis
**Data Extraction by Row (Top to Bottom, Left to Right):**
*Uncertainty: The exact meaning of the colors is not defined in the image. The following is a precise transcription of visible elements.*
* **Row 1:** [Red 1], [Green 2], [Red 2], [Green 3], [Red 4], [Blue 1], [Red 4]
* **Row 2:** [Green 1], [Red 3], [Blue 4], [Red 5], [Green 1], [Red 4]
* **Row 3:** [Red 1], [Green 2], [Red 7? *Note: Appears as a 7, but outside stated 1-5 range. Likely a visual artifact or misread; context suggests it may be a 1 or 2.*], [Blue 5], [Red 2]
* **Row 4:** [Red 4], [Green 5], [Red 2], [Black 1], [Red 1], [Blue 1]
* **Row 5:** [Red 1], [Green 1], [Red 5], [Black 2], [Red 1]
* **Row 6:** [Red 1], [Blue 1], [Red 4], [Green 2]
* **Row 7:** [Black 1], [Red 4], [Blue 2]
* **Row 8:** [Red 3], [Green 3], [Red 1], [Blue 4]
* **Row 9:** [Red 2], [Blue 4], [Red 1]
* **Row 10:** [Red 3], [Green 4], [Red 1]
**Color Distribution Summary:**
* **Red:** The most frequent color, appearing in all rows and most columns.
* **Green:** Appears frequently, often adjacent to red numbers in the top-left cluster.
* **Blue:** Appears less frequently than red and green, often in isolated cells or small groups.
* **Black:** Appears the least frequently, with instances in Row 4, Row 5, and Row 7.
### Key Observations
1. **Spatial Clustering:** Two primary clusters of data exist:
* A dense cluster in the top-left 5x5 region.
* A smaller, dense cluster in the bottom-right 4x4 region (Rows 7-10, Columns 7-10).
2. **Color Patterns:** Within the top-left cluster, red and green numbers are heavily intermixed. Blue numbers appear more sporadically. Black numbers are rare and appear only in the central vertical band (Columns 5-6).
3. **Value Range:** Most numbers are within 1-5. One cell in Row 3, Column 3 contains a character that resembles a '7', which is an outlier if accurate. All other numbers are clearly 1-5.
4. **Empty Cells:** Significant empty space exists in the central rows (5-7) and the bottom-left quadrant, creating a visual separation between the two main clusters.
### Interpretation
The image presents a data matrix where the **information is encoded in the combination of numerical value, color, and spatial position**. Without a legend or axis labels, the specific meaning is ambiguous, but the structure suggests several possibilities:
* **A Heatmap or Correlation Matrix:** The colors could represent different categories, data sources, or levels of significance (e.g., red for high, green for medium, blue for low). The numbers might be scores, counts, or ratings. The clustering could indicate groups of related items.
* **A Game Board or Puzzle State:** The grid, limited number range, and color coding are reminiscent of logic puzzles or board games where players place numbered tokens.
* **A Sparse Data Visualization:** It could represent the output of an algorithm or a snapshot of a system where only specific cells are active (colored/numbered) at a given time.
**The most notable pattern is the non-random distribution.** The two distinct clusters suggest the data is not uniformly random but follows an underlying rule or represents two separate groups or phases. The color mixing within clusters implies a relationship or interaction between the categories the colors represent. The outlier '7' (if not an artifact) would be a critical point of interest, potentially indicating an error, a special case, or a different data type.
**To fully understand this data, a legend defining the color semantics and axis labels defining the row/column categories would be essential.** The current image provides the raw data structure but not its semantic context.