## Scatter Plot: Output Token Position Index vs Decoding Steps
### Overview
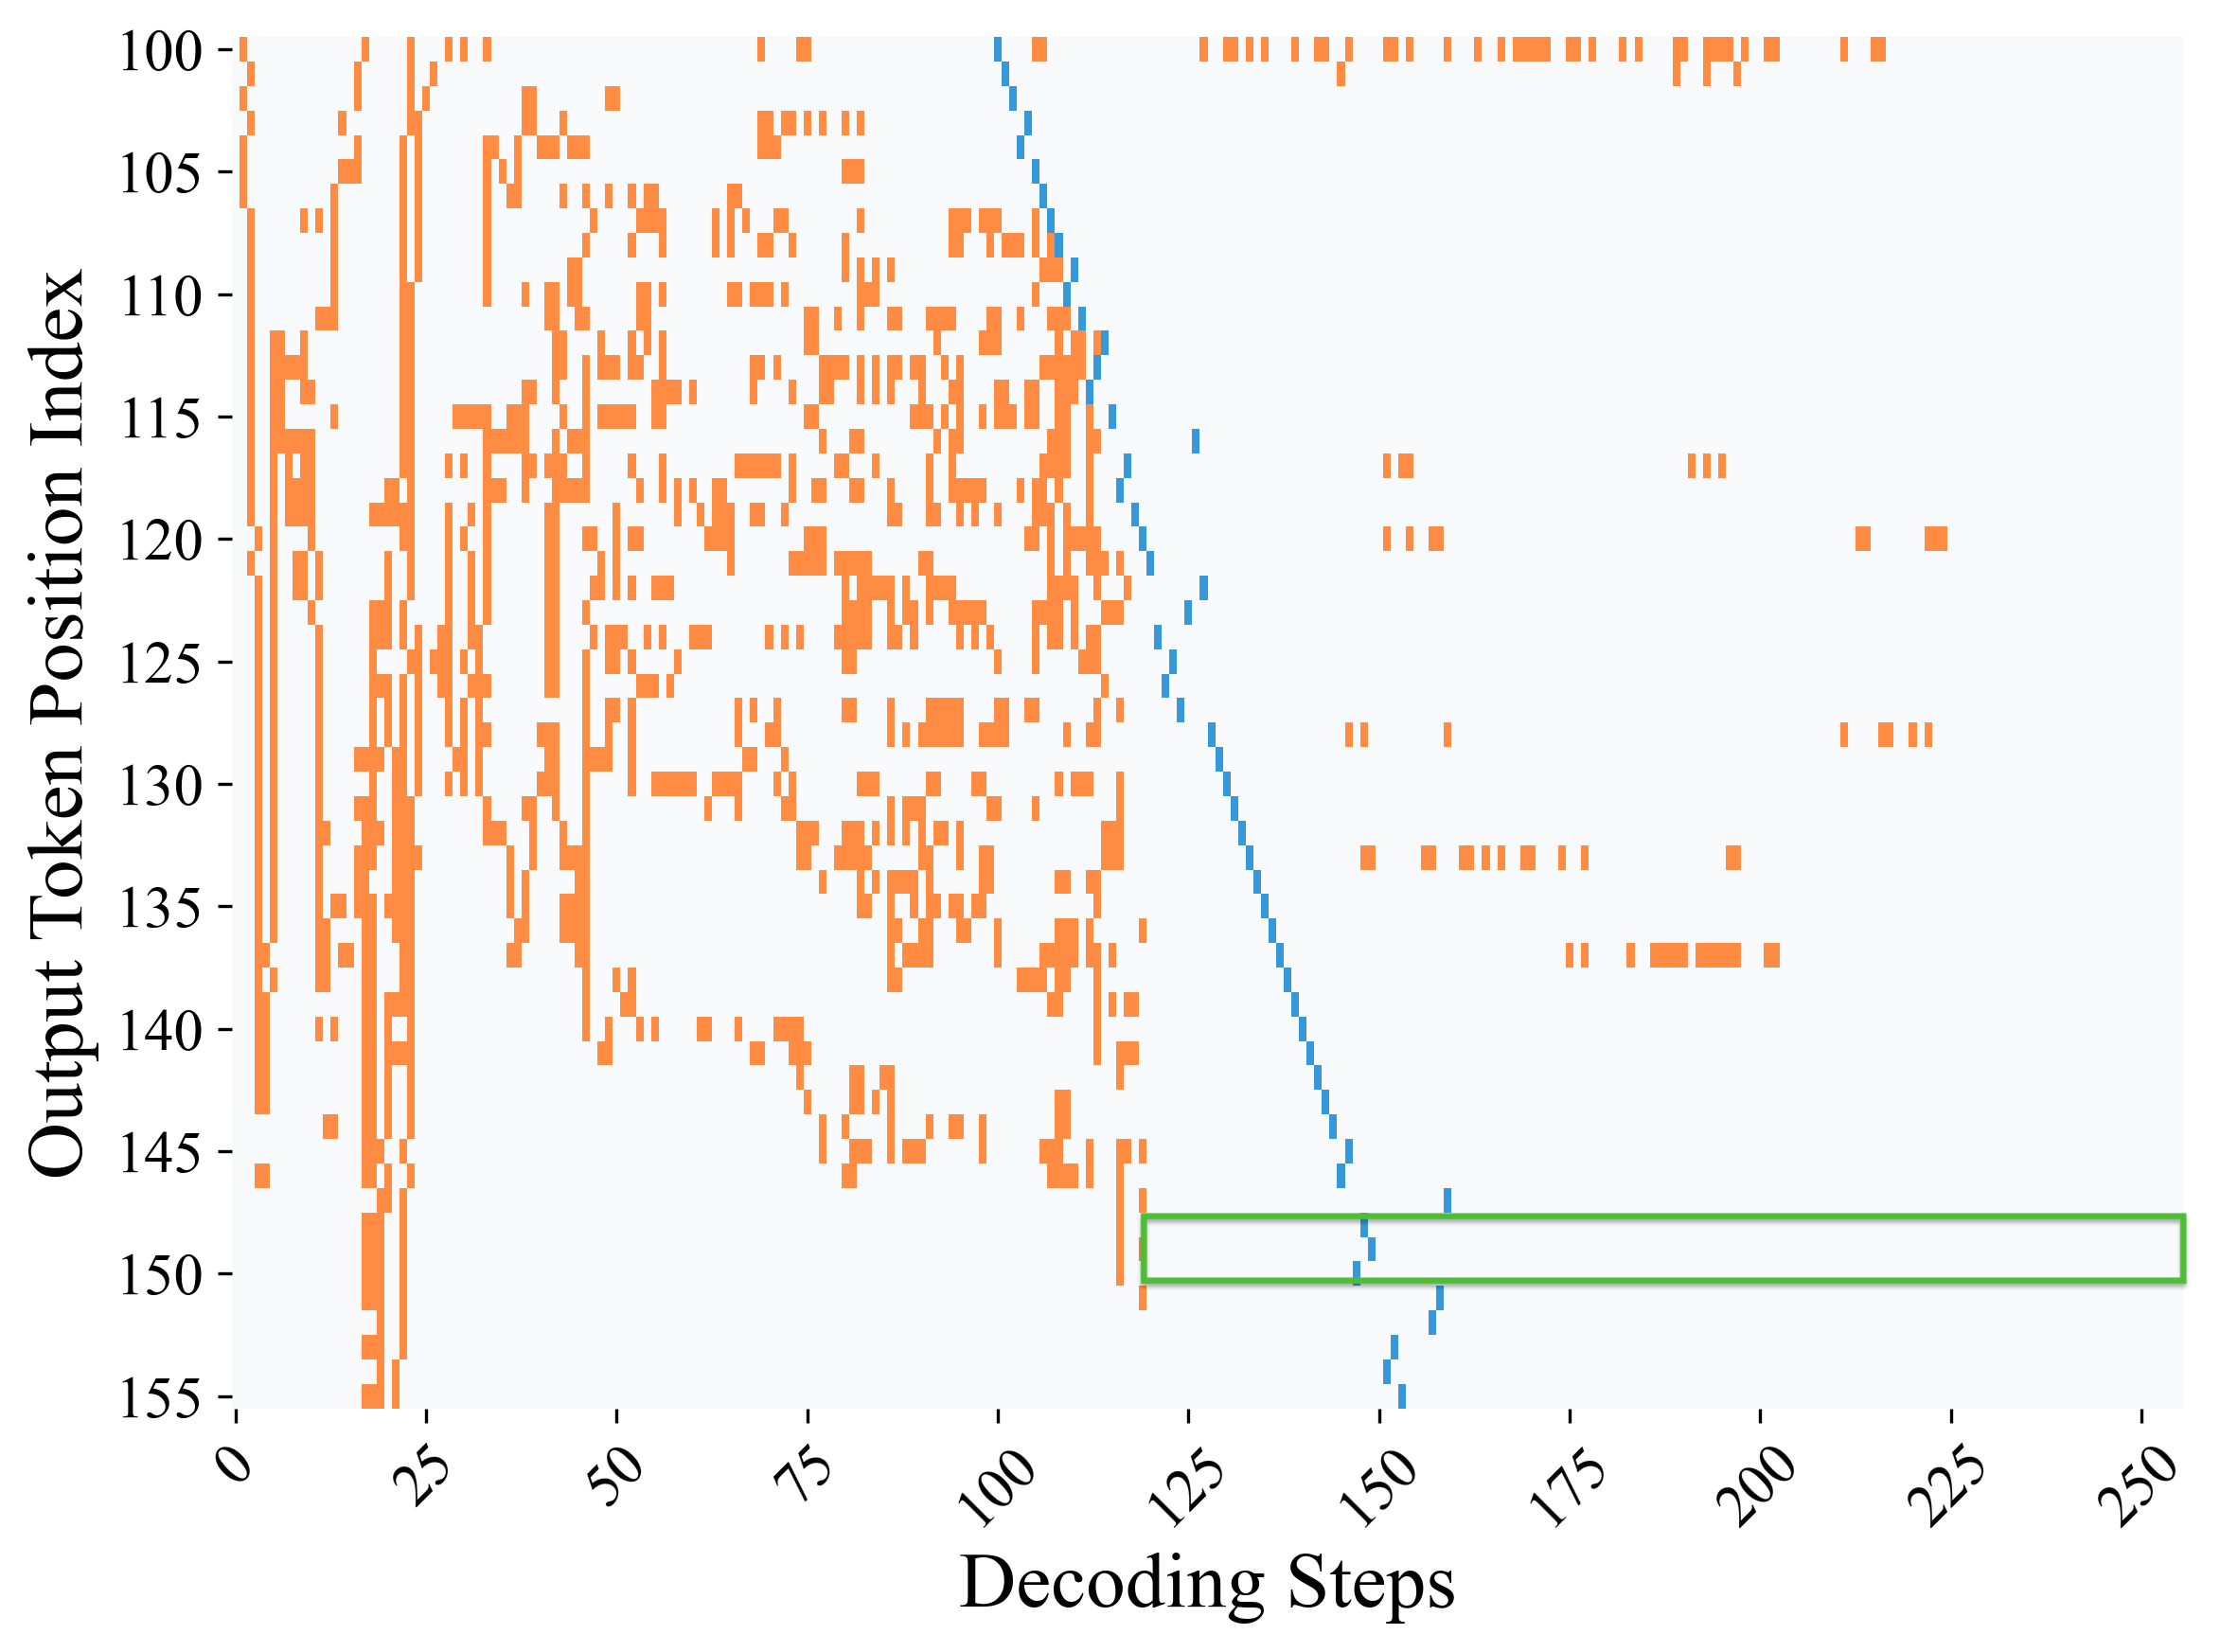
The image depicts a scatter plot visualizing the relationship between decoding steps and output token position indices. Two distinct data series are represented: orange points labeled "Token Position Distribution" and a blue line labeled "Decoding Trajectory." A green rectangular highlight is present in the lower-right quadrant.
### Components/Axes
- **X-axis (Decoding Steps)**:
- Range: 0 to 250
- Major ticks: 0, 25, 50, 75, 100, 125, 150, 175, 200, 225, 250
- Label: "Decoding Steps" (black text, bold)
- **Y-axis (Output Token Position Index)**:
- Range: 100 to 155
- Major ticks: 100, 105, 110, 115, 120, 125, 130, 135, 140, 145, 150, 155
- Label: "Output Token Position Index" (black text, bold)
- **Legend**:
- Position: Right side of the plot
- Entries:
- Orange square: "Token Position Distribution"
- Blue square: "Decoding Trajectory"
- **Highlight**:
- Green rectangle spanning decoding steps 125–250 and token positions 150–155
### Detailed Analysis
1. **Token Position Distribution (Orange Points)**:
- Density: Highest concentration in the lower-left quadrant (decoding steps 0–50, token positions 100–120).
- Distribution: Sparse and scattered in the upper-right quadrant (decoding steps 150–250, token positions 130–155).
- Notable: No orange points in the green-highlighted region (125–250 decoding steps, 150–155 token positions).
2. **Decoding Trajectory (Blue Line)**:
- Trend: Linear decline from ~150 token position at decoding step 0 to ~100 at decoding step 250.
- Slope: Approximately -0.2 token position per decoding step.
- Intersection: Crosses the green-highlighted region at decoding step ~150, token position ~150.
### Key Observations
- **Concentration vs. Dispersion**: Token positions cluster tightly early in decoding but spread out later.
- **Negative Correlation**: The blue line indicates a consistent decrease in token position index with increasing decoding steps.
- **Empty Highlight**: The green rectangle contains no data points, suggesting no activity in this region.
### Interpretation
The plot demonstrates that early decoding steps (0–50) produce highly concentrated token positions, while later steps (100–250) show dispersed distributions. The blue line’s negative slope implies that token positions systematically decrease as decoding progresses, potentially reflecting a model’s ability to refine predictions over time. The green-highlighted region (125–250 decoding steps, 150–155 token positions) appears to be a theoretical boundary with no observed data, possibly indicating a design constraint or an unexplored operational regime. The absence of points in this area suggests either a limitation in the model’s capacity to reach higher token positions during extended decoding or a deliberate truncation of outputs beyond a certain threshold.