## Heatmap: Output Token Position Index vs. Decoding Steps
### Overview
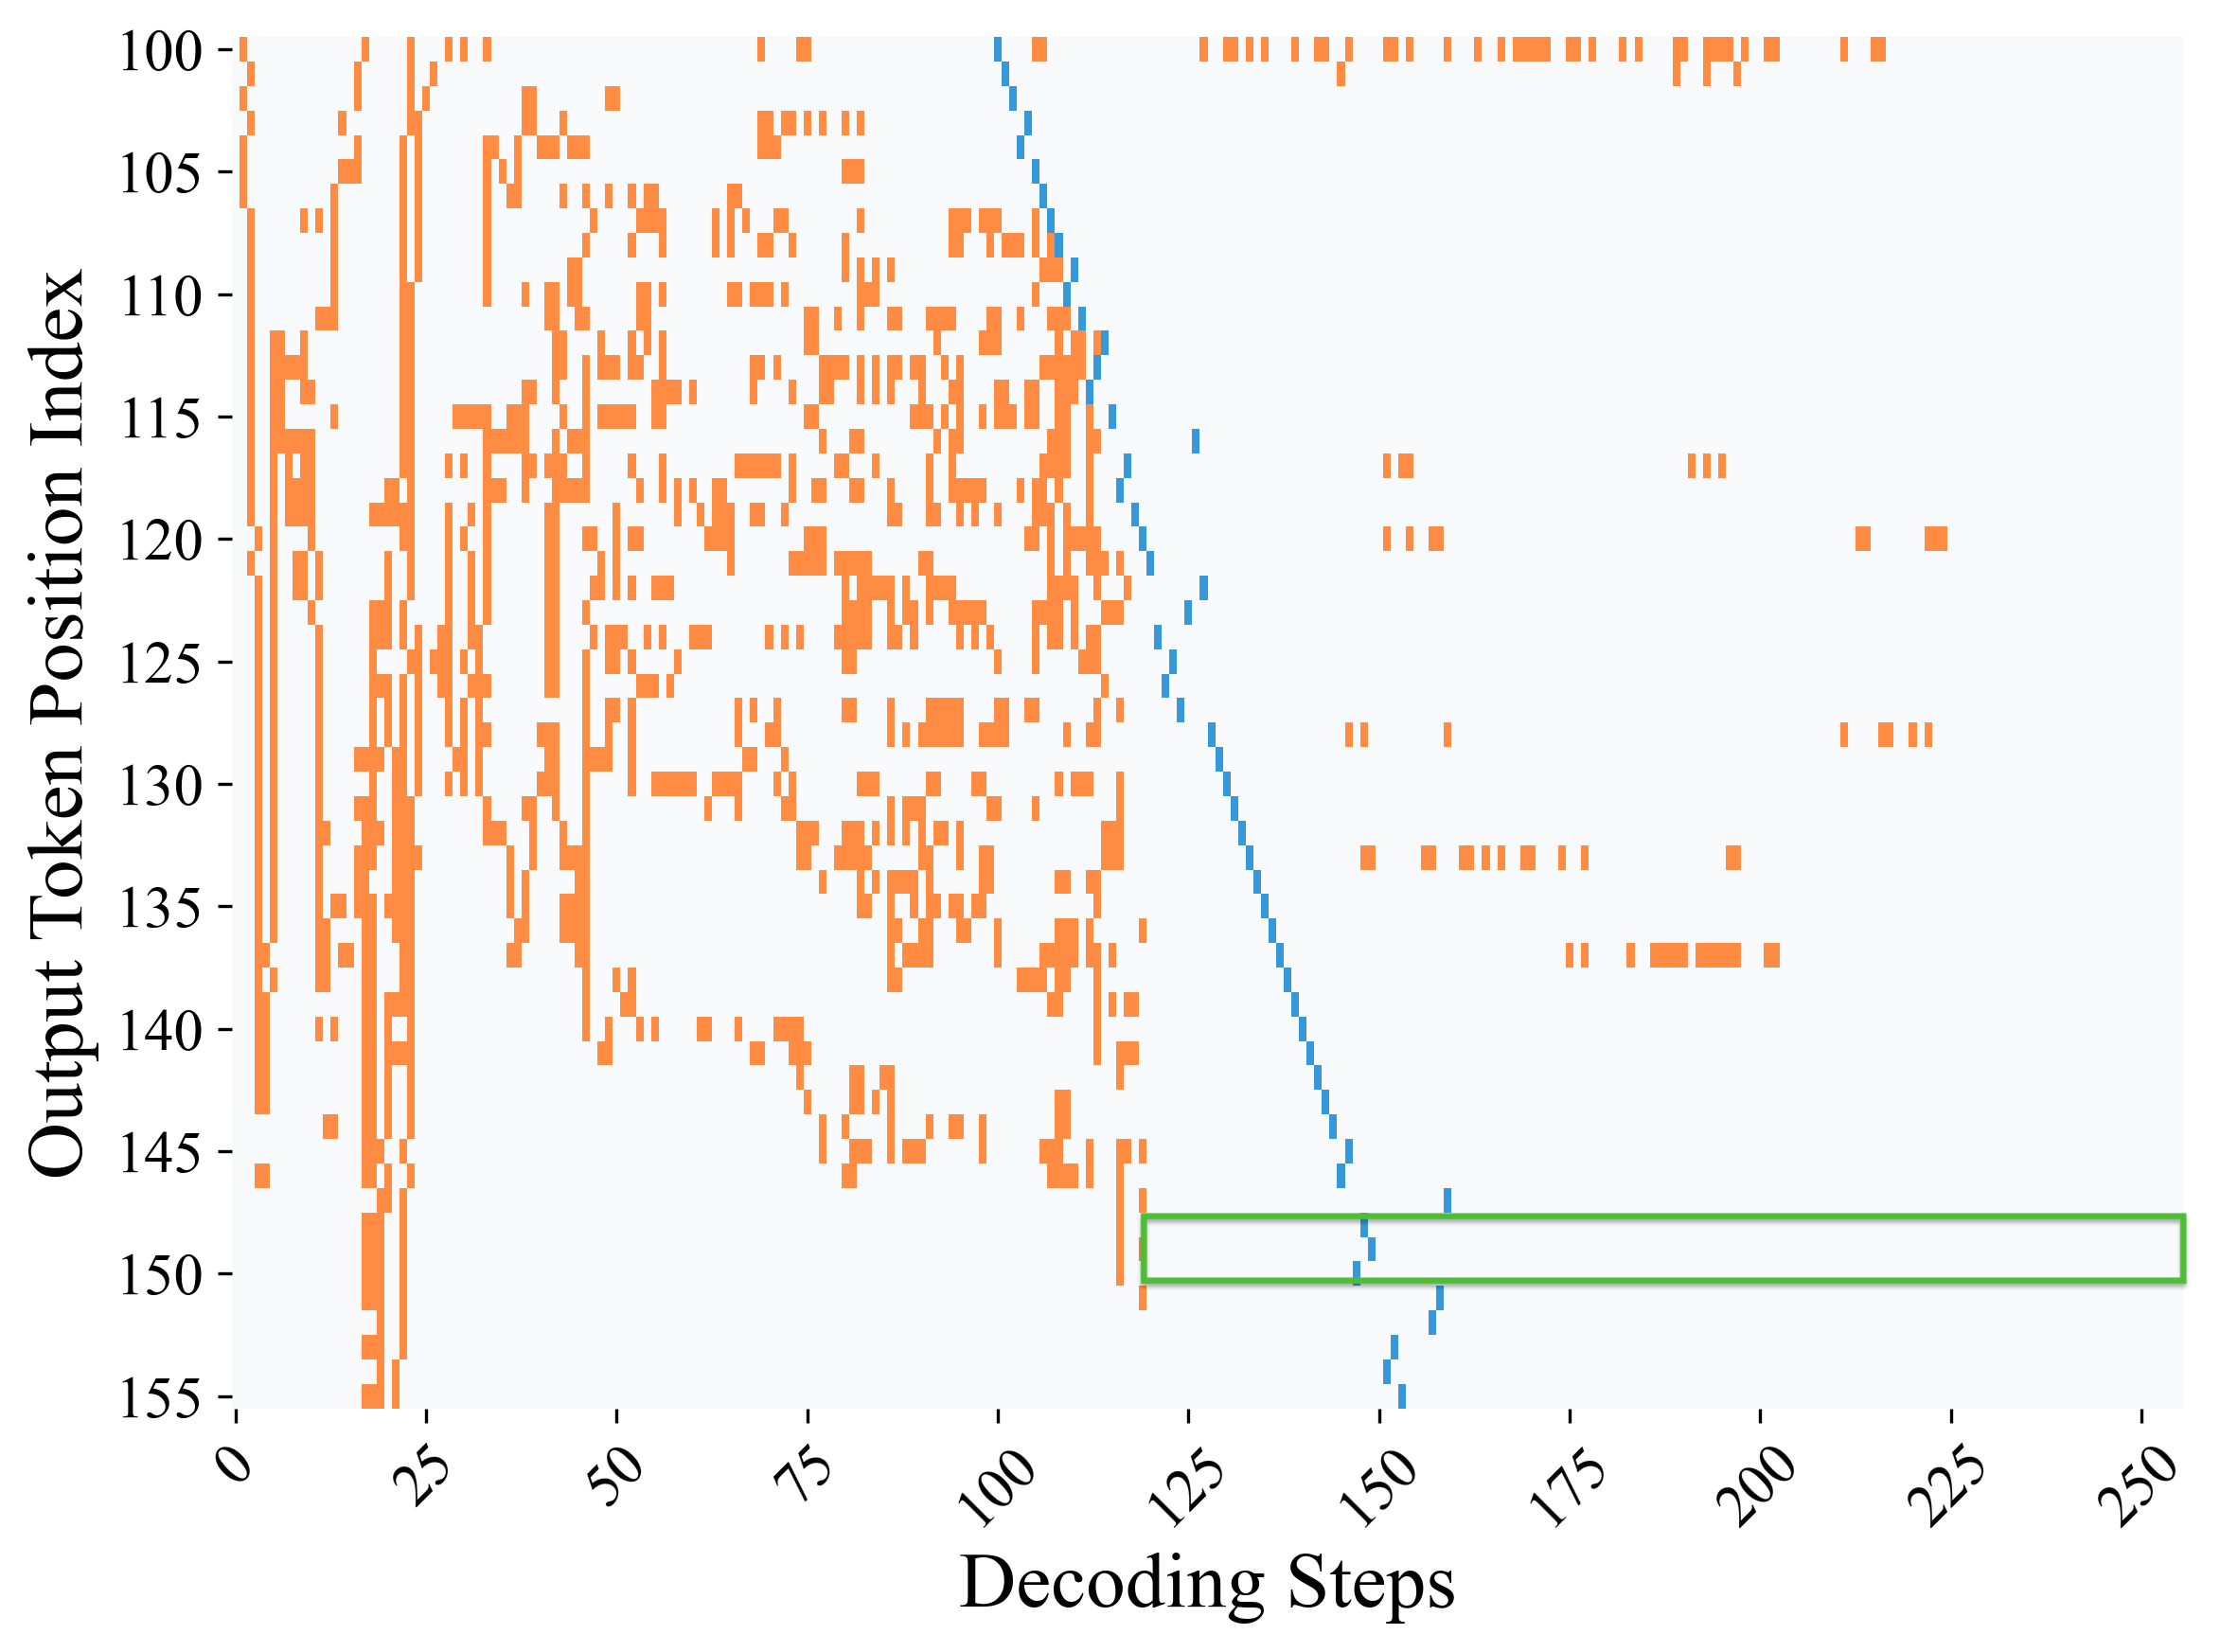
The image is a heatmap visualizing the relationship between the output token position index and decoding steps. The x-axis represents decoding steps, ranging from 0 to 250. The y-axis represents the output token position index, ranging from 100 to 155. Orange blocks indicate the presence of a token at a specific position index during a particular decoding step. A blue line indicates a specific event or transition during the decoding process. A green rectangle highlights a region of interest.
### Components/Axes
* **X-axis:** Decoding Steps, ranging from 0 to 250 in increments of 25.
* **Y-axis:** Output Token Position Index, ranging from 100 to 155 in increments of 5.
* **Orange Blocks:** Indicate the presence of a token at a specific position index during a particular decoding step.
* **Blue Line:** A diagonal line starting at approximately (100, 100) and ending at approximately (155, 155).
* **Green Rectangle:** A rectangle spanning from approximately (120, 148) to (250, 152).
### Detailed Analysis or ### Content Details
* **Orange Blocks:**
* From decoding steps 0 to approximately 120, there is a high density of orange blocks, indicating frequent token presence across various position indices.
* After decoding step 120, the density of orange blocks decreases significantly, suggesting fewer tokens are present at different position indices.
* The orange blocks are scattered and less concentrated as the decoding steps increase beyond 120.
* **Blue Line:**
* The blue line starts at approximately decoding step 100 and position index 100.
* It progresses diagonally downwards to approximately decoding step 155 and position index 155.
* The line appears to be relatively linear.
* **Green Rectangle:**
* The green rectangle spans from approximately decoding step 120 to 250.
* It covers the position index range of approximately 148 to 152.
### Key Observations
* The density of tokens is significantly higher in the initial decoding steps (0-120) compared to later steps (120-250).
* The blue line represents a clear transition or event during the decoding process.
* The green rectangle highlights a specific region of interest in the later decoding steps.
### Interpretation
The heatmap visualizes the token generation process during decoding. The high density of orange blocks in the initial steps suggests that the model is actively exploring and generating tokens across a wide range of positions. The blue line likely indicates a shift or convergence in the decoding process, possibly representing the model focusing on specific tokens or positions. The green rectangle might highlight a region where the model is refining or finalizing the output sequence. The sparse orange blocks after decoding step 120 suggest that the model has largely determined the output sequence and is making minor adjustments or completing the process.