## Bar Chart: Task Performance Comparison
### Overview
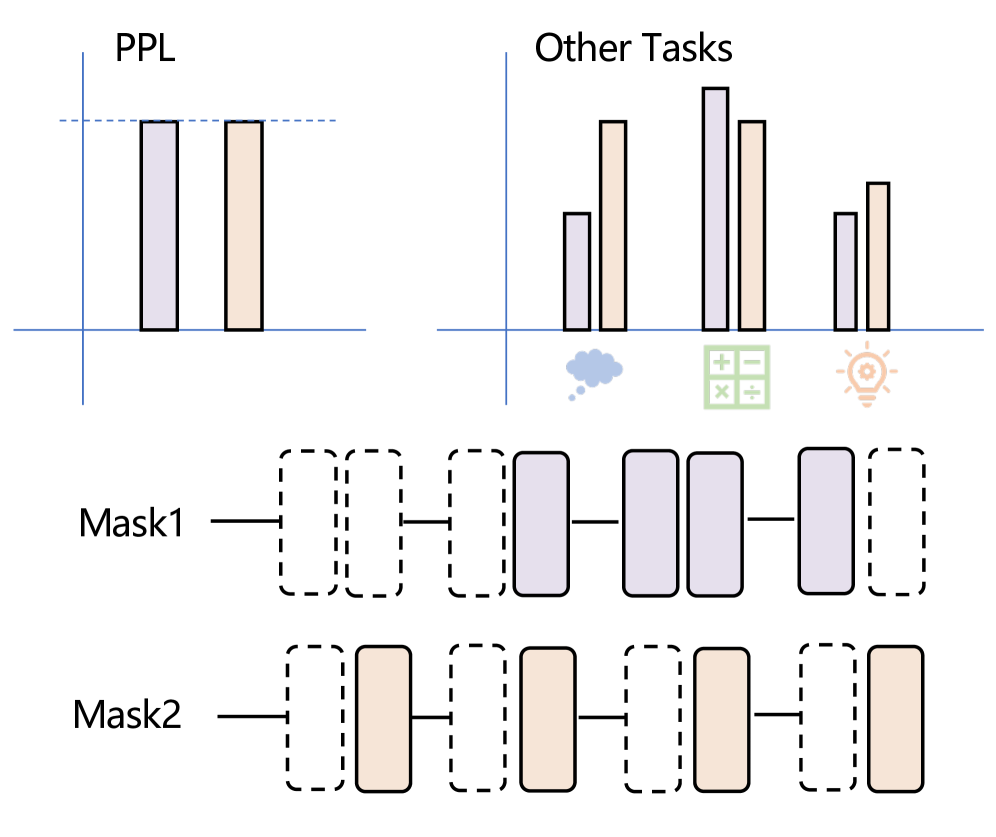
The image is a bar chart comparing task performance across two categories: "PPL" and "Other Tasks." Each category contains two bars (purple and beige), with a legend indicating "Mask1" (purple) and "Mask2" (beige). Below the chart, two diagrams labeled "Mask1" and "Mask2" show grouped bars, suggesting a relationship between the masks and task performance.
### Components/Axes
- **X-axis**: Labeled "PPL" and "Other Tasks."
- **Y-axis**: Labeled with a scale from 0 to 100 (no explicit unit).
- **Legend**: Located at the bottom, with "Mask1" (purple) and "Mask2" (beige).
- **Symbols**:
- "Other Tasks" includes three categories:
- Cloud (🌤️)
- Calculator (📊)
- Lightbulb (💡)
### Detailed Analysis
- **PPL Section**:
- Both bars (purple and beige) reach the maximum value of 100.
- A dashed horizontal line at 100 indicates a threshold or target.
- **Other Tasks Section**:
- **Cloud (🌤️)**:
- Purple (Mask1): ~60
- Beige (Mask2): ~80
- **Calculator (📊)**:
- Purple (Mask1): ~90
- Beige (Mask2): ~85
- **Lightbulb (💡)**:
- Purple (Mask1): ~70
- Beige (Mask2): ~75
- **Mask Diagrams**:
- **Mask1**: Two purple bars (left) and two beige bars (right), grouped in pairs.
- **Mask2**: Two beige bars (left) and two purple bars (right), grouped in pairs.
### Key Observations
1. **PPL Consistency**: Both masks achieve the maximum value (100) in the "PPL" category, suggesting it is a critical or standardized task.
2. **Other Tasks Variability**:
- "Cloud" shows the largest gap between masks (20 units).
- "Calculator" has a smaller gap (5 units).
- "Lightbulb" has a moderate gap (5 units).
3. **Mask Grouping**: The diagrams indicate that Mask1 and Mask2 group tasks differently, with Mask1 prioritizing purple (higher values in "Calculator") and Mask2 prioritizing beige (higher values in "Cloud").
### Interpretation
The chart highlights differences in task performance between two masks. The "PPL" category is consistently high, implying it is a baseline or essential task. In "Other Tasks," Mask1 performs better in "Calculator" (90 vs. 85), while Mask2 excels in "Cloud" (80 vs. 60). The lightbulb task shows similar performance across masks. The mask diagrams suggest that the grouping of tasks (e.g., pairing purple/beige bars) may reflect different configurations or priorities. The dashed line at 100 in the PPL section could indicate a performance ceiling or target.
### Notable Trends
- **Mask1** prioritizes "Calculator" tasks (highest value: 90).
- **Mask2** prioritizes "Cloud" tasks (highest value: 80).
- "PPL" is the only category where both masks achieve the maximum value, suggesting it is a non-negotiable or standardized task.
### Uncertainties
- Exact numerical values are approximate (e.g., ~60, ~80) due to the lack of gridlines or precise scale markers.
- The purpose of the "Mask" diagrams (e.g., whether they represent data grouping, configuration, or another metric) is not explicitly stated.