## Line Graph: Generalized SBM vs SBM
### Overview
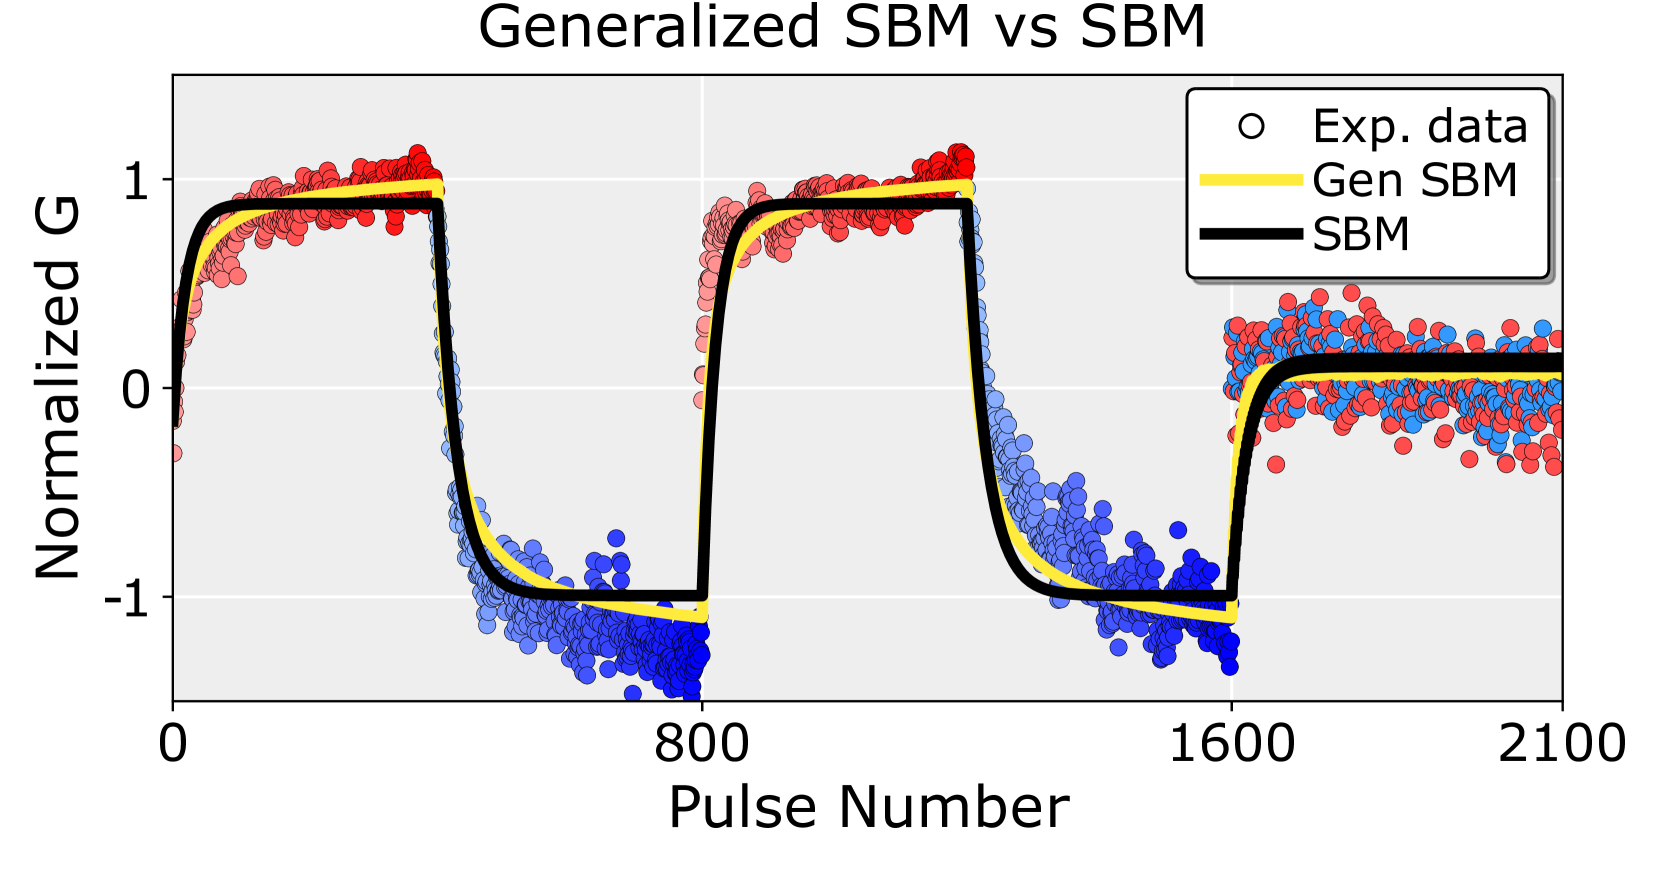
The image is a line graph comparing experimental data (Exp. data) with two theoretical models: Generalized SBM (Gen SBM) and SBM. The graph plots "Normalized G" against "Pulse Number," showing oscillatory behavior with sharp transitions between positive and negative values. The experimental data is represented by red and blue circles, while the models are depicted as yellow and black lines.
### Components/Axes
- **X-axis (Pulse Number)**: Ranges from 0 to 2100, with no intermediate labels.
- **Y-axis (Normalized G)**: Ranges from -1 to 1, with gridlines at -1, 0, and 1.
- **Legend**: Located in the top-right corner, with three entries:
- **Exp. data**: Red and blue circles (open symbols).
- **Gen SBM**: Yellow line.
- **SBM**: Black line.
### Detailed Analysis
1. **Experimental Data (Exp. data)**:
- Red circles cluster near the top of the graph (Normalized G ≈ 1) between Pulse Numbers 0–400 and 1200–1600.
- Blue circles cluster near the bottom (Normalized G ≈ -1) between Pulse Numbers 400–800 and 1600–2100.
- Data points are densely packed, with minimal scatter.
2. **Model Lines**:
- **SBM (Black Line)**:
- Follows the experimental data closely, with sharp transitions:
- Rises from 0 to 1 between Pulse Numbers 0–400.
- Drops to -1 between Pulse Numbers 400–800.
- Rises to 1 between Pulse Numbers 800–1200.
- Drops to -1 between Pulse Numbers 1200–1600.
- Rises back to 0 between Pulse Numbers 1600–2100.
- **Gen SBM (Yellow Line)**:
- Mirrors the SBM line but with slightly smoother transitions, deviating minimally from the experimental data.
3. **Key Observations**:
- Both models (SBM and Gen SBM) closely track the experimental data, suggesting high fidelity in capturing the underlying pattern.
- The experimental data exhibits a binary-like oscillation, with abrupt shifts between positive and negative values.
- The Gen SBM line (yellow) appears marginally smoother than the SBM line (black), but both align tightly with the data points.
### Interpretation
The graph demonstrates that both the SBM and Gen SBM models effectively replicate the oscillatory behavior observed in the experimental data. The sharp transitions in the data suggest a system with binary or switch-like dynamics (e.g., on/off states). The close alignment between the models and the data implies that the generalized model (Gen SBM) does not significantly outperform the standard SBM in this context, though its smoother transitions might indicate a different underlying assumption or regularization. The experimental data’s tight clustering around the model lines highlights consistency in measurements, with no apparent outliers or anomalies.