## Line Chart: Surprisal vs. Training Steps
### Overview
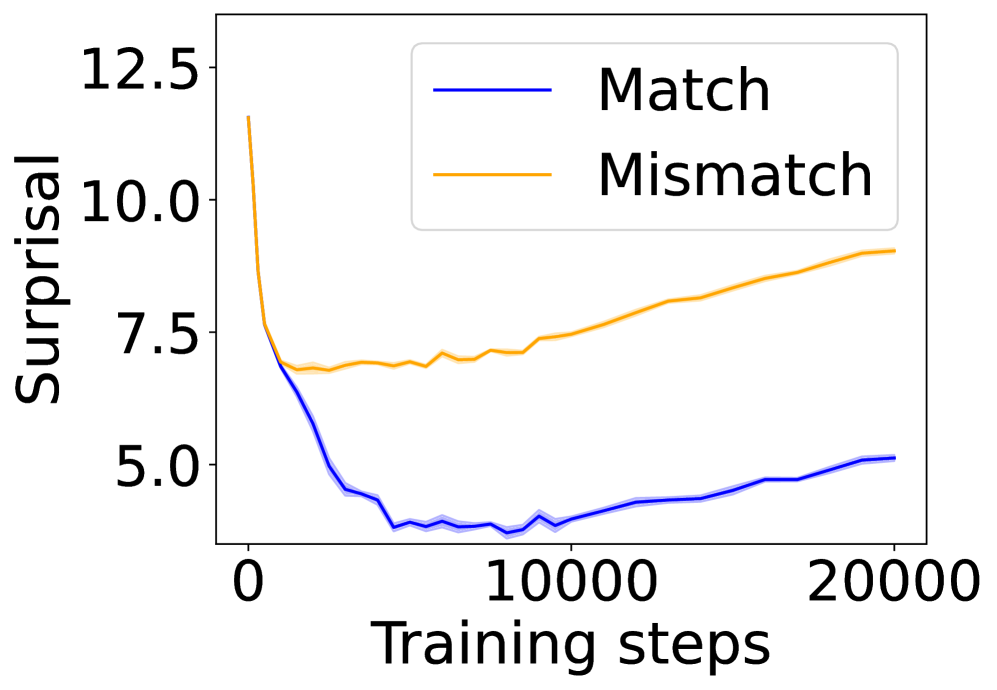
The image is a line chart that plots "Surprisal" on the y-axis against "Training steps" on the x-axis. Two data series are displayed: "Match" (blue line) and "Mismatch" (orange line). The chart illustrates how surprisal changes with increasing training steps for both conditions. Shaded regions around each line likely represent confidence intervals or standard deviations.
### Components/Axes
* **X-axis:** "Training steps" with values ranging from 0 to 20000, incrementing by 5000.
* **Y-axis:** "Surprisal" with values ranging from approximately 4 to 12.5, incrementing by 2.5.
* **Legend:** Located in the top-right corner, it identifies the two data series:
* "Match" - represented by a blue line.
* "Mismatch" - represented by an orange line.
### Detailed Analysis
* **Match (Blue Line):**
* Trend: Initially decreases sharply, then plateaus, and finally increases slightly.
* Data Points:
* At 0 training steps, surprisal is approximately 7.5.
* At 2500 training steps, surprisal is approximately 4.5.
* From 5000 to 10000 training steps, surprisal remains relatively constant at approximately 4.
* At 20000 training steps, surprisal is approximately 5.
* **Mismatch (Orange Line):**
* Trend: Initially decreases sharply, then plateaus, and finally increases steadily.
* Data Points:
* At 0 training steps, surprisal is approximately 12.
* At 2500 training steps, surprisal is approximately 7.
* From 5000 to 10000 training steps, surprisal remains relatively constant at approximately 7.
* At 20000 training steps, surprisal is approximately 9.
### Key Observations
* The "Match" condition shows a significant initial drop in surprisal, indicating rapid learning.
* The "Mismatch" condition also shows an initial drop, but not as drastic as the "Match" condition.
* Both conditions plateau after the initial drop, but the "Mismatch" condition shows a steady increase in surprisal as training continues, while the "Match" condition remains relatively stable.
### Interpretation
The chart suggests that the model learns to "match" expected outcomes more efficiently than dealing with "mismatched" outcomes. The initial sharp decrease in surprisal for both conditions indicates a quick adaptation to the training data. However, the subsequent increase in surprisal for the "Mismatch" condition suggests that the model continues to struggle with unexpected or inconsistent inputs as training progresses. The "Match" condition's stable surprisal after the initial drop implies that the model has effectively learned to predict and handle expected outcomes. The shaded regions around the lines likely represent the variability in the model's performance, with wider regions indicating greater uncertainty.