## Line Graph: Surprisal Trends in Match vs. Mismatch Training
### Overview
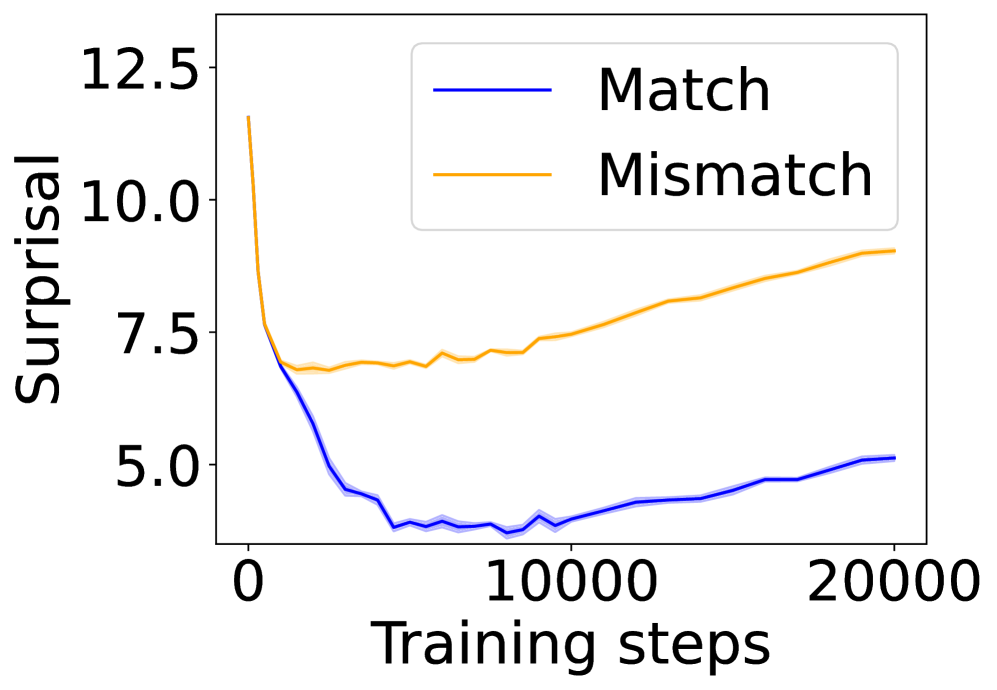
The graph illustrates the evolution of "Surprisal" values over "Training steps" for two scenarios: "Match" (blue line) and "Mismatch" (orange line). Surprisal is measured on the y-axis (5.0–12.5), while training steps span the x-axis (0–20,000). The legend is positioned in the top-right corner, with blue representing "Match" and orange representing "Mismatch."
### Components/Axes
- **X-axis (Training steps)**: Labeled "Training steps," ranging from 0 to 20,000 in increments of 10,000.
- **Y-axis (Surprisal)**: Labeled "Surprisal," ranging from 5.0 to 12.5 in increments of 2.5.
- **Legend**: Located in the top-right corner, with:
- Blue line: "Match"
- Orange line: "Mismatch"
### Detailed Analysis
1. **Match (Blue Line)**:
- **Initial Drop**: Starts at approximately 12.5 surprisal at 0 training steps, sharply declining to ~5.0 by 5,000 steps.
- **Stabilization**: Remains near 5.0 with minor fluctuations (e.g., slight dips to ~4.5 between 5,000–10,000 steps) until 20,000 steps.
- **Final Value**: Ends at ~5.0 surprisal.
2. **Mismatch (Orange Line)**:
- **Initial Value**: Begins at ~7.5 surprisal at 0 steps, rising gradually to ~9.0 by 20,000 steps.
- **Trend**: Shows a steady upward trajectory with minor plateaus (e.g., ~7.8 at 10,000 steps, ~8.5 at 15,000 steps).
- **Final Value**: Ends at ~9.0 surprisal.
### Key Observations
- **Divergence**: The "Match" line diverges sharply from the "Mismatch" line in the first 5,000 steps, while the "Mismatch" line remains relatively stable until later stages.
- **Stabilization**: Both lines stabilize after ~10,000 steps, but "Mismatch" continues to increase slowly.
- **Surprisal Dynamics**: "Match" surprisal decreases significantly, suggesting reduced uncertainty or better alignment with training data, while "Mismatch" surprisal increases, indicating growing uncertainty or misalignment.
### Interpretation
The graph suggests that training under "Match" conditions leads to a rapid reduction in surprisal, likely due to effective learning or alignment with expected patterns. In contrast, "Mismatch" conditions result in sustained or increasing surprisal, implying the model struggles to adapt to less relevant or conflicting data. The divergence highlights the impact of training data relevance on model performance, with "Match" scenarios favoring stability and "Mismatch" scenarios introducing persistent uncertainty. The gradual rise in "Mismatch" surprisal after 10,000 steps may indicate delayed recognition of data misalignment or compounding errors.