\n
## Bar Chart: Performance Speedup vs. Threshold
### Overview
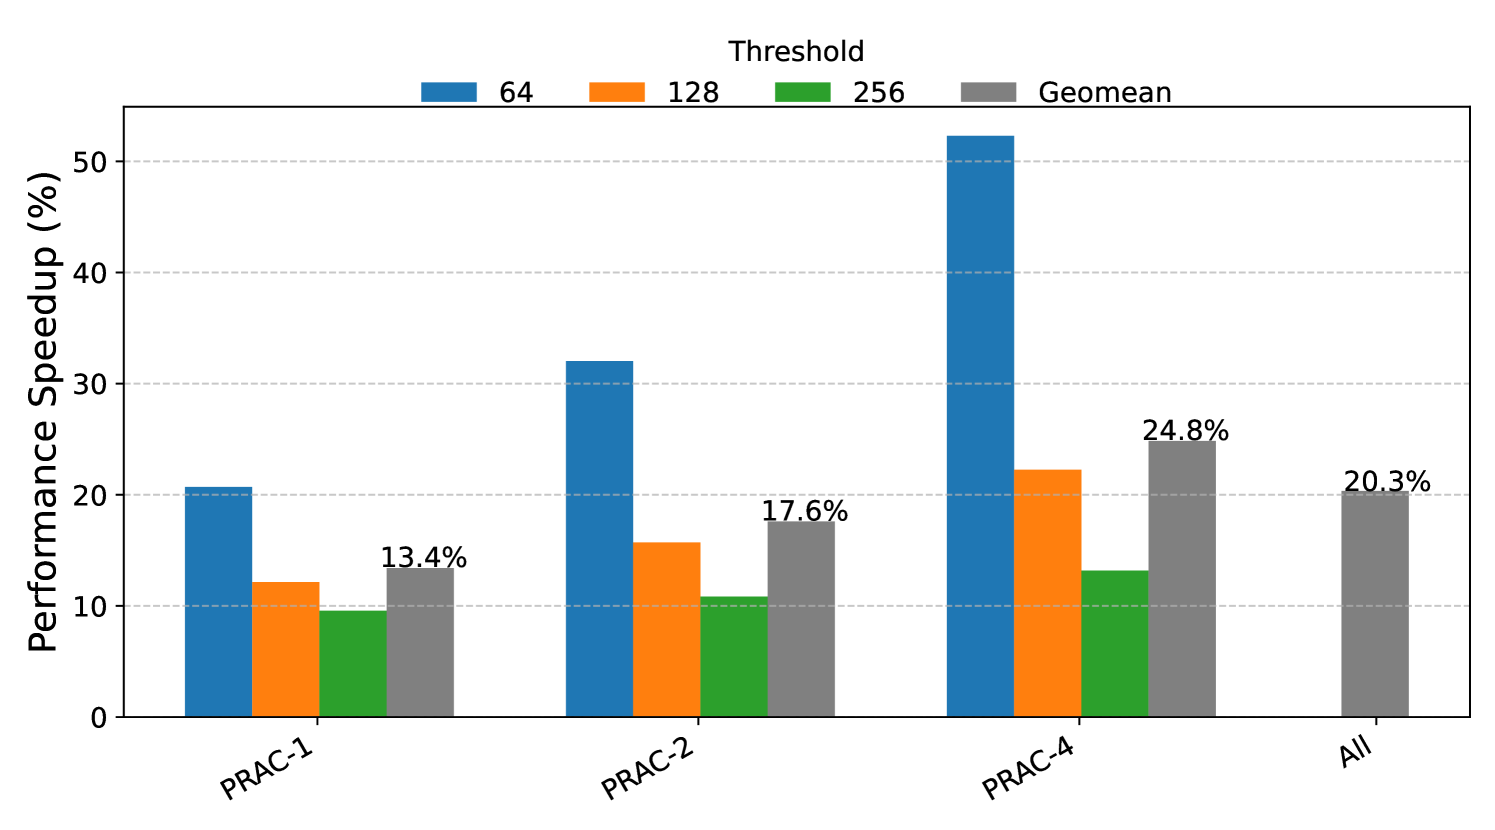
This bar chart illustrates the performance speedup (in percentage) achieved for different workloads (PRAC-1, PRAC-2, PRAC-4, and All) using varying thresholds (64, 128, 256) and the geometric mean. The y-axis represents the performance speedup in percentage, while the x-axis represents the workload.
### Components/Axes
* **X-axis:** Workload - PRAC-1, PRAC-2, PRAC-4, All
* **Y-axis:** Performance Speedup (%) - Scale ranges from 0 to 55, with increments of 10.
* **Legend:** Located at the top-center of the chart.
* 64 (Blue)
* 128 (Orange)
* 256 (Gray)
* Geomean (Dark Gray)
### Detailed Analysis
The chart consists of grouped bar plots for each workload, representing the performance speedup for each threshold and the geometric mean.
**PRAC-1:**
* Threshold 64 (Blue): Approximately 19%.
* Threshold 128 (Orange): Approximately 11%.
* Threshold 256 (Gray): Approximately 13.4%.
* Geomean (Dark Gray): Approximately 13.4%.
**PRAC-2:**
* Threshold 64 (Blue): Approximately 32%.
* Threshold 128 (Orange): Approximately 15%.
* Threshold 256 (Gray): Approximately 17.6%.
* Geomean (Dark Gray): Approximately 17.6%.
**PRAC-4:**
* Threshold 64 (Blue): Approximately 52%.
* Threshold 128 (Orange): Approximately 22%.
* Threshold 256 (Gray): Approximately 24.8%.
* Geomean (Dark Gray): Approximately 24.8%.
**All:**
* Threshold 64 (Blue): Approximately 28%.
* Threshold 128 (Orange): Approximately 18%.
* Threshold 256 (Gray): Approximately 20.3%.
* Geomean (Dark Gray): Approximately 20.3%.
### Key Observations
* For all workloads, the threshold of 64 generally yields the highest performance speedup.
* The performance speedup decreases as the threshold increases from 64 to 128 and 256.
* The Geomean values are consistent with the threshold 256 values.
* PRAC-4 shows the most significant speedup, particularly with a threshold of 64.
* PRAC-1 shows the least speedup across all thresholds.
### Interpretation
The data suggests that a lower threshold (64) generally leads to better performance speedup across all workloads. This could be due to the increased granularity of data processing at lower thresholds, allowing for more efficient optimization. The geometric mean provides a consolidated view of performance, aligning with the results obtained at a threshold of 256. The varying speedup across different workloads (PRAC-1, PRAC-2, PRAC-4, and All) indicates that the optimal threshold might be workload-dependent. PRAC-4, exhibiting the highest speedup, may benefit more from the lower threshold due to its specific characteristics. The consistent trend of decreasing speedup with increasing thresholds suggests a trade-off between threshold granularity and computational cost. The "All" workload represents an average across all workloads, and its performance is generally lower than the best-performing individual workload (PRAC-4).