## Bar Chart: Number of Tokens After First Step vs. Pass@1
### Overview
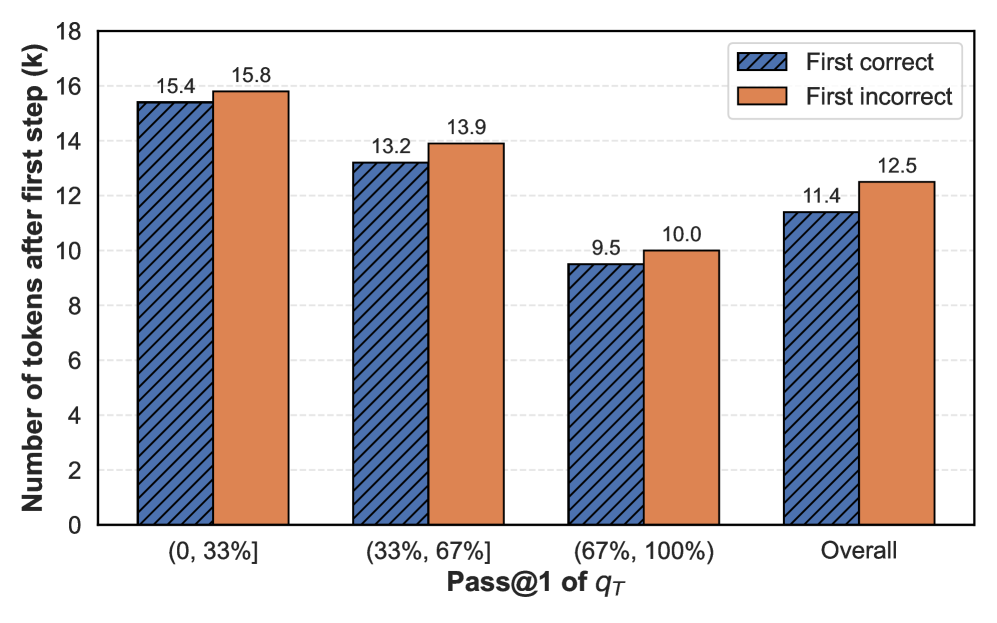
The image is a bar chart comparing the number of tokens after the first step for "First correct" and "First incorrect" scenarios, categorized by Pass@1 of qT ranges: (0, 33%], (33%, 67%], (67%, 100%], and Overall.
### Components/Axes
* **Y-axis:** "Number of tokens after first step (k)". The scale ranges from 0 to 18, with tick marks at every increment of 2.
* **X-axis:** "Pass@1 of qT". Categories are: (0, 33%], (33%, 67%], (67%, 100%], and Overall.
* **Legend:** Located at the top-right corner.
* Blue with diagonal lines: "First correct"
* Orange: "First incorrect"
### Detailed Analysis
The chart presents data for two categories: "First correct" and "First incorrect", across four "Pass@1 of qT" categories.
* **(0, 33%] Category:**
* "First correct": 15.4k tokens
* "First incorrect": 15.8k tokens
* **(33%, 67%] Category:**
* "First correct": 13.2k tokens
* "First incorrect": 13.9k tokens
* **(67%, 100%] Category:**
* "First correct": 9.5k tokens
* "First incorrect": 10.0k tokens
* **Overall Category:**
* "First correct": 11.4k tokens
* "First incorrect": 12.5k tokens
**Trend Verification:**
* **First Correct:** The number of tokens decreases as Pass@1 increases from (0, 33%] to (67%, 100%], then increases slightly for the Overall category.
* **First Incorrect:** The number of tokens also decreases as Pass@1 increases from (0, 33%] to (67%, 100%], then increases slightly for the Overall category.
### Key Observations
* For all Pass@1 categories, the number of tokens is higher when the first step is incorrect compared to when it is correct.
* The difference between "First correct" and "First incorrect" is smallest in the (67%, 100%] category.
* The number of tokens is highest in the (0, 33%] category for both "First correct" and "First incorrect".
### Interpretation
The data suggests that a higher number of tokens after the first step is associated with an incorrect first step. This could indicate that when the first step is incorrect, the model needs more tokens to correct or recover from the initial error. The trend of decreasing tokens as Pass@1 increases suggests that higher Pass@1 values are associated with fewer tokens needed after the first step, regardless of whether the first step was correct or incorrect. The "Overall" category shows a slight increase in the number of tokens compared to the (67%, 100%] category, which might reflect the distribution of Pass@1 values in the overall dataset.