\n
## Line Chart: Accuracy vs. Model Size
### Overview
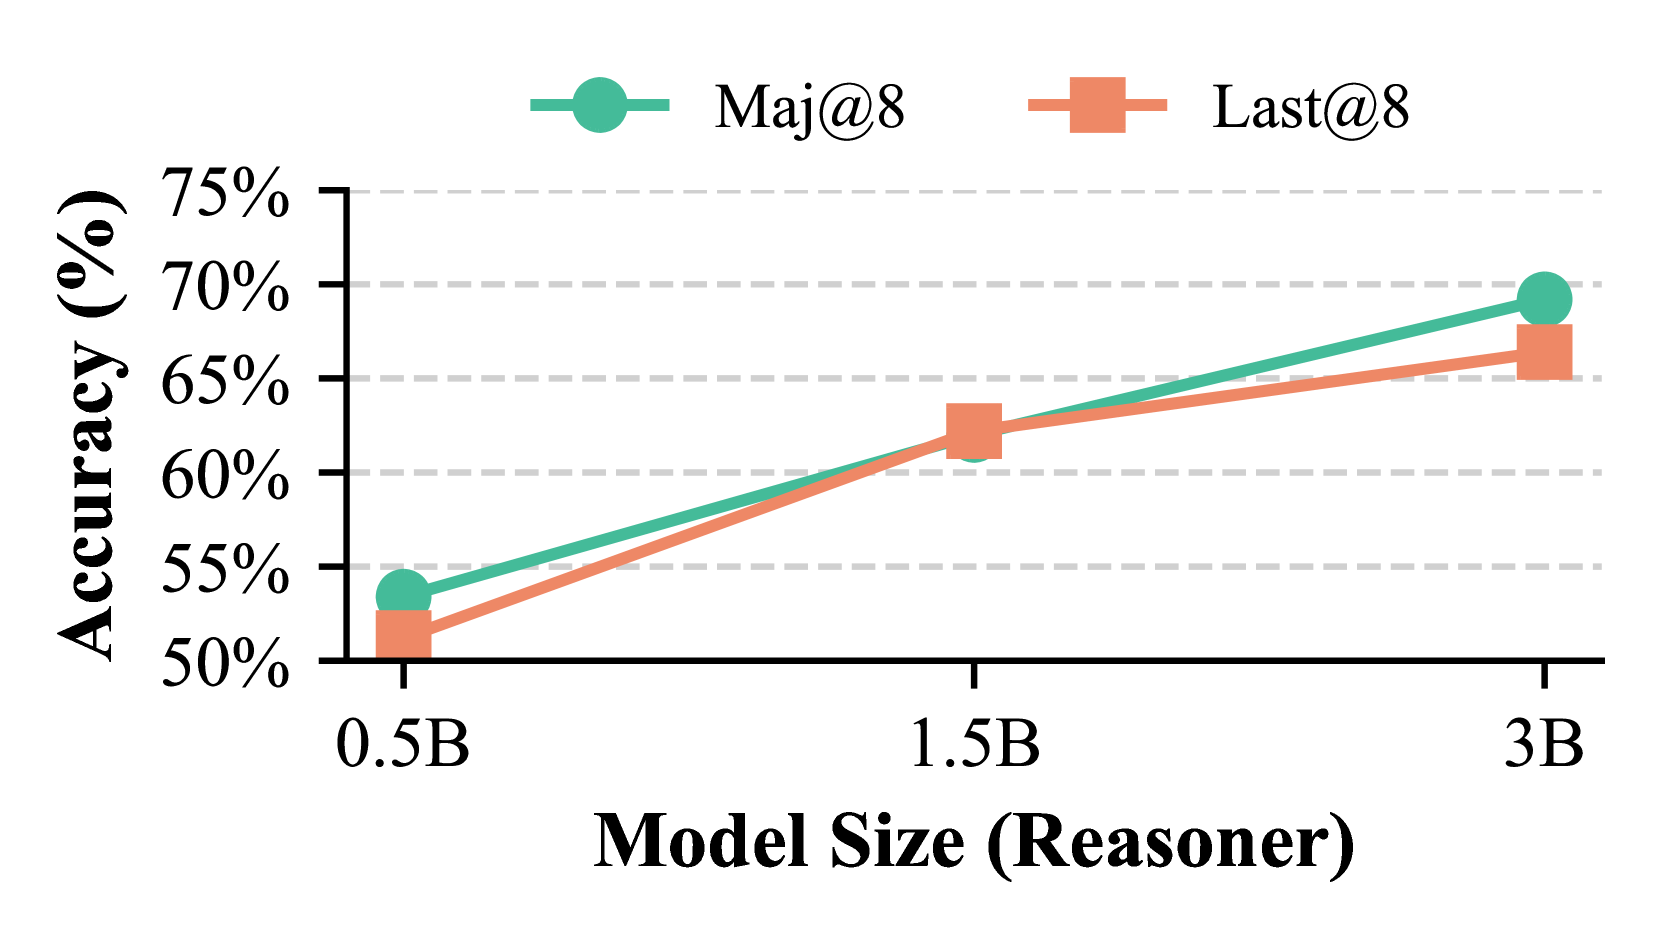
This line chart depicts the relationship between model size (Reasoner) and accuracy for two metrics: Maj@8 and Last@8. The x-axis represents model size in billions of parameters (0.5B, 1.5B, 3B), and the y-axis represents accuracy as a percentage (ranging from 50% to 75%). The chart shows how accuracy changes as the model size increases for each metric.
### Components/Axes
* **X-axis:** "Model Size (Reasoner)" with markers at 0.5B, 1.5B, and 3B.
* **Y-axis:** "Accuracy (%)" with a scale ranging from 50% to 75% in 5% increments.
* **Legend:** Located at the top-right of the chart.
* "Maj@8" - Represented by a grey circular marker and a grey line.
* "Last@8" - Represented by a salmon/red square marker and a salmon/red line.
* **Gridlines:** Horizontal dashed grey lines at 50%, 55%, 60%, 65%, 70%, and 75%.
### Detailed Analysis
**Maj@8 (Grey Line):**
The grey line representing Maj@8 shows an upward trend as model size increases.
* At 0.5B, the accuracy is approximately 53%.
* At 1.5B, the accuracy increases to approximately 61%.
* At 3B, the accuracy reaches approximately 68%.
**Last@8 (Salmon/Red Line):**
The salmon/red line representing Last@8 also shows an upward trend, but it starts lower and ends higher than Maj@8.
* At 0.5B, the accuracy is approximately 51%.
* At 1.5B, the accuracy increases to approximately 63%.
* At 3B, the accuracy reaches approximately 69%.
### Key Observations
* Both metrics (Maj@8 and Last@8) demonstrate a positive correlation with model size – larger models generally achieve higher accuracy.
* Last@8 consistently exhibits slightly lower accuracy than Maj@8 at 0.5B and 1.5B, but surpasses Maj@8 at 3B.
* The increase in accuracy is more pronounced between 0.5B and 1.5B for both metrics than between 1.5B and 3B, suggesting diminishing returns with increasing model size.
### Interpretation
The data suggests that increasing the model size (Reasoner) improves performance on both Maj@8 and Last@8 metrics. The difference in performance between the two metrics indicates they are measuring different aspects of the model's reasoning ability. Maj@8 likely assesses the model's ability to identify the most relevant information, while Last@8 may evaluate its ability to consider all available information, even less prominent details. The diminishing returns observed at larger model sizes suggest that there's a point where increasing model size yields less significant improvements in accuracy. This could be due to factors like data limitations or the inherent complexity of the task. The crossover at 3B is interesting, and could indicate that Last@8 benefits more from increased model capacity than Maj@8. Further investigation would be needed to understand the underlying reasons for these trends.