# Technical Data Extraction: Performance Metrics Across Datasets
This document provides a comprehensive extraction of data from three line charts representing performance metrics (F1 Score, Hit rate@10, and NDCG@10) across three different datasets: **Dataset A**, **Dataset B**, and **Dataset C**.
## 1. Global Metadata and Legend
All three charts share a common structure and legend.
* **X-Axis:** Numerical scale ranging from approximately 0.5 to 1.5.
* **Y-Axis:** Performance score (decimal scale).
* **Legend Components:**
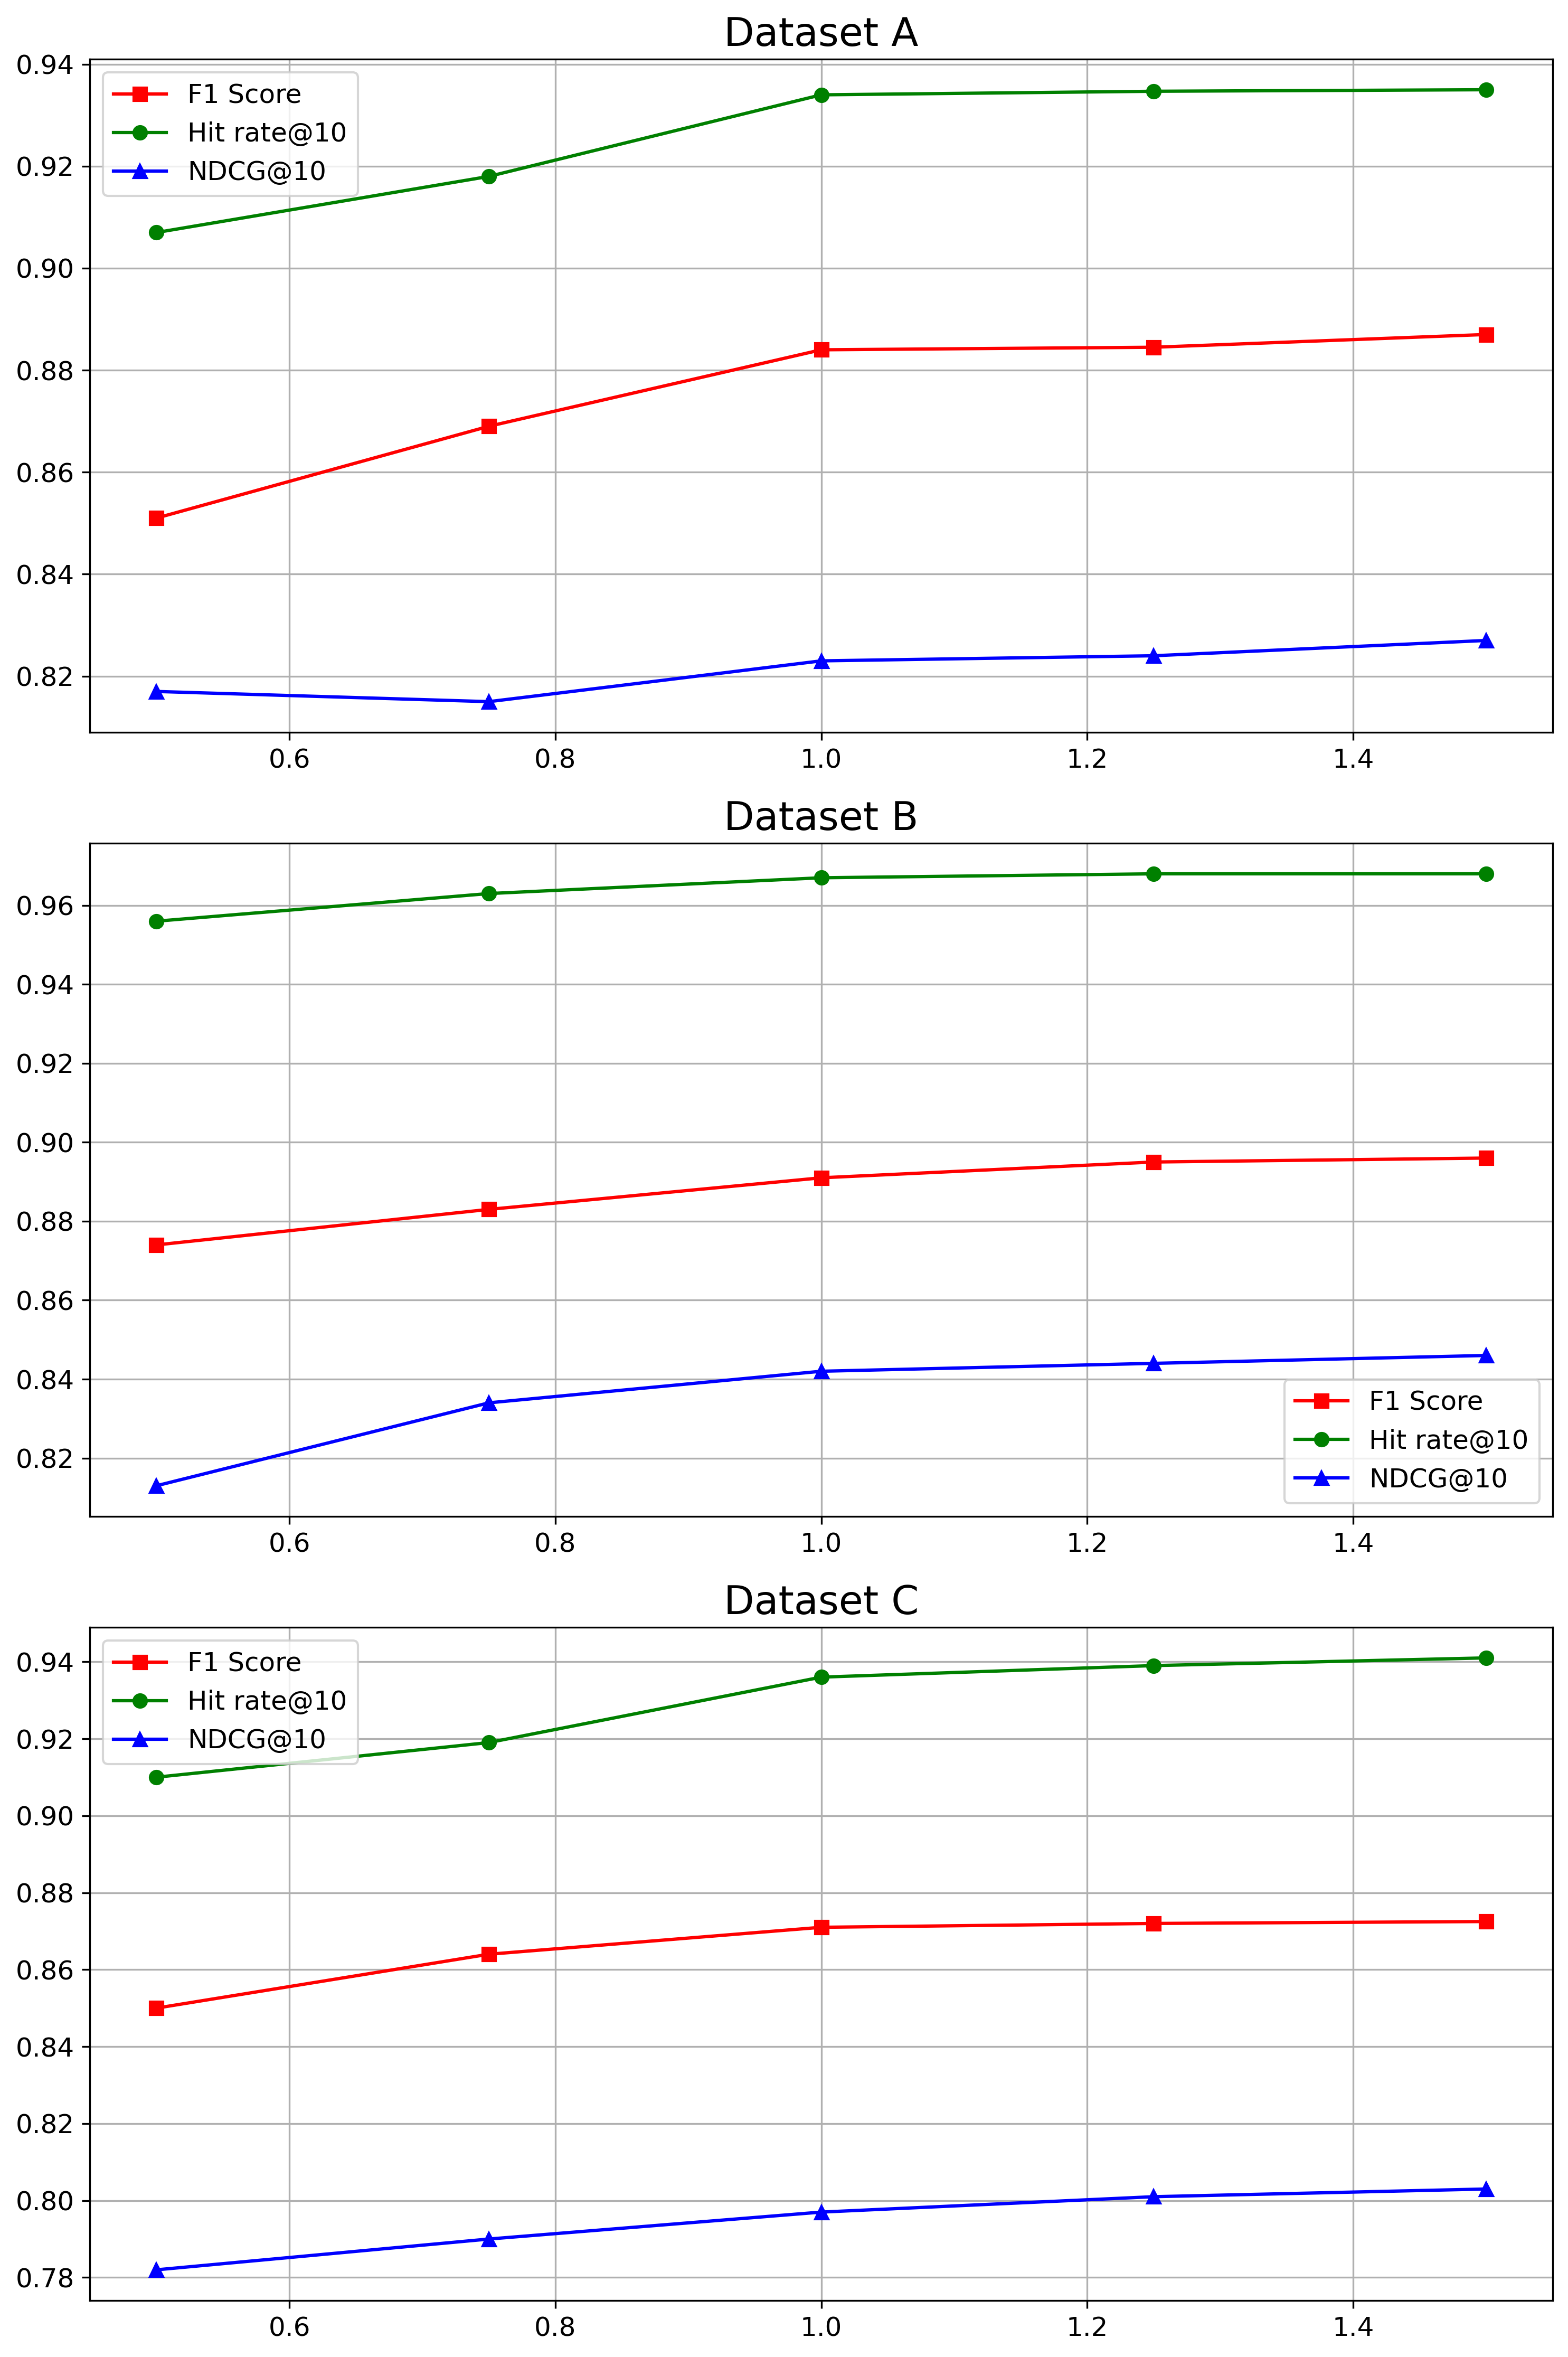
* **Red Line with Square Markers ($\blacksquare$):** F1 Score
* **Green Line with Circle Markers ($\bullet$):** Hit rate@10
* **Blue Line with Triangle Markers ($\blacktriangle$):** NDCG@10
* **Spatial Grounding (Legend):**
* Dataset A: Top-left [x $\approx$ 0.5, y $\approx$ 0.93]
* Dataset B: Bottom-right [x $\approx$ 1.3, y $\approx$ 0.83]
* Dataset C: Top-left [x $\approx$ 0.5, y $\approx$ 0.93]
---
## 2. Dataset A Analysis
### Trend Verification
* **Hit rate@10 (Green):** Slopes upward from 0.5 to 1.0, then plateaus between 1.0 and 1.5.
* **F1 Score (Red):** Slopes upward steadily from 0.5 to 1.0, then shows a very slight positive slope/plateau from 1.0 to 1.5.
* **NDCG@10 (Blue):** Slopes slightly downward from 0.5 to 0.75, then slopes upward to 1.0, followed by a plateau/slight increase to 1.5.
### Data Points (Approximate)
| X-Value | F1 Score (Red) | Hit rate@10 (Green) | NDCG@10 (Blue) |
| :--- | :--- | :--- | :--- |
| 0.5 | 0.851 | 0.907 | 0.817 |
| 0.75 | 0.869 | 0.918 | 0.815 |
| 1.0 | 0.884 | 0.934 | 0.823 |
| 1.25 | 0.8845 | 0.935 | 0.824 |
| 1.5 | 0.887 | 0.935 | 0.827 |
---
## 3. Dataset B Analysis
### Trend Verification
* **Hit rate@10 (Green):** Consistent upward slope from 0.5 to 1.25, reaching a plateau at 1.5. This dataset shows the highest overall values for this metric (approaching 0.97).
* **F1 Score (Red):** Steady upward slope across the entire x-axis range.
* **NDCG@10 (Blue):** Strong upward slope from 0.5 to 1.0, then tapers to a gentle upward slope from 1.0 to 1.5.
### Data Points (Approximate)
| X-Value | F1 Score (Red) | Hit rate@10 (Green) | NDCG@10 (Blue) |
| :--- | :--- | :--- | :--- |
| 0.5 | 0.874 | 0.956 | 0.813 |
| 0.75 | 0.883 | 0.963 | 0.834 |
| 1.0 | 0.891 | 0.968 | 0.842 |
| 1.25 | 0.895 | 0.969 | 0.844 |
| 1.5 | 0.896 | 0.969 | 0.846 |
---
## 4. Dataset C Analysis
### Trend Verification
* **Hit rate@10 (Green):** Slopes upward from 0.5 to 1.0, then continues with a very slight upward slope to 1.5.
* **F1 Score (Red):** Slopes upward from 0.5 to 1.0, then plateaus almost completely from 1.0 to 1.5.
* **NDCG@10 (Blue):** Consistent, steady upward slope across the entire range from 0.5 to 1.5. Note: This dataset has the lowest NDCG@10 values (starting below 0.79).
### Data Points (Approximate)
| X-Value | F1 Score (Red) | Hit rate@10 (Green) | NDCG@10 (Blue) |
| :--- | :--- | :--- | :--- |
| 0.5 | 0.850 | 0.910 | 0.782 |
| 0.75 | 0.864 | 0.919 | 0.790 |
| 1.0 | 0.871 | 0.936 | 0.797 |
| 1.25 | 0.872 | 0.939 | 0.801 |
| 1.5 | 0.8725 | 0.941 | 0.803 |
---
## Summary of Findings
1. **Metric Ranking:** Across all datasets, **Hit rate@10** (Green) is consistently the highest performing metric, followed by **F1 Score** (Red), with **NDCG@10** (Blue) being the lowest.
2. **Performance by Dataset:** Dataset B exhibits the highest overall performance across all three metrics compared to Datasets A and C.
3. **Sensitivity to X-Axis:** All metrics generally improve as the X-axis value increases from 0.5 to 1.0. Beyond 1.0, the gains diminish, often resulting in a plateau, particularly for Hit rate@10 and F1 Score.