## Diagram: Neural Association Model
### Overview
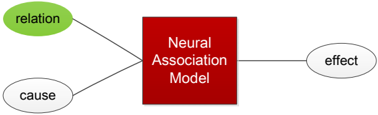
The image is a diagram illustrating a Neural Association Model. It shows the relationship between "relation", "cause", and "effect" through the model.
### Components/Axes
* **Nodes:**
* "relation" (green oval, top-left)
* "cause" (white oval, bottom-left)
* "effect" (white oval, right)
* **Model:** "Neural Association Model" (red square, center)
* **Connections:** Lines connecting the nodes to the model.
### Detailed Analysis
* The "relation" node on the top-left is connected to the "Neural Association Model" in the center.
* The "cause" node on the bottom-left is connected to the "Neural Association Model" in the center.
* The "Neural Association Model" in the center is connected to the "effect" node on the right.
### Key Observations
* The diagram shows a flow from "relation" and "cause" to the "Neural Association Model", and then from the model to "effect".
* The "relation" node is colored green, while the "cause" and "effect" nodes are white. The "Neural Association Model" is red.
### Interpretation
The diagram represents a system where "relation" and "cause" are inputs to a "Neural Association Model", which then produces an "effect". The diagram suggests that the model uses the relationship and cause to determine the effect. The different colors of the nodes and the model might indicate different types or roles within the system. The diagram illustrates a basic causal relationship mediated by a neural association model.