## Line Chart: Throughput vs. Input Size (n)
### Overview
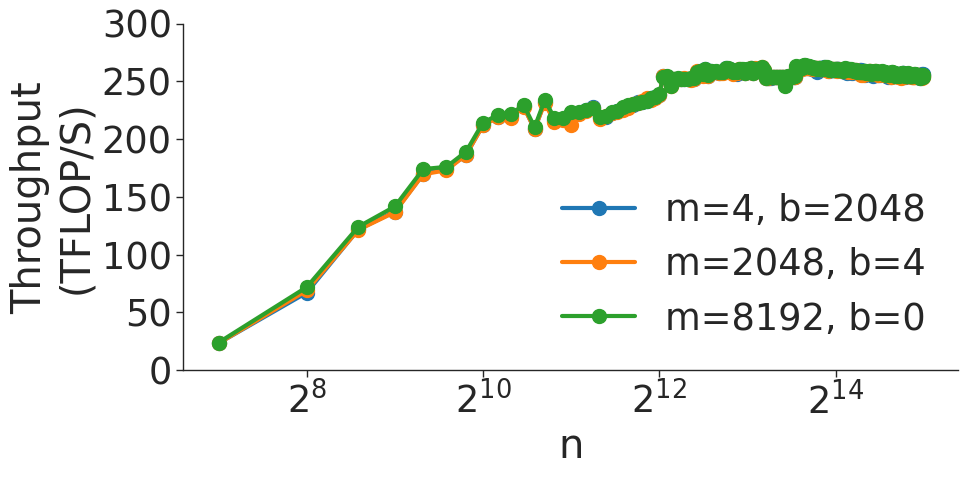
This chart illustrates the computational throughput (measured in TFLOP/S) as a function of input size 'n' for three distinct parameter configurations (m, b). The chart demonstrates that throughput increases rapidly with input size before reaching a saturation point (plateau) at higher values of 'n'. Notably, the three configurations yield nearly identical performance results across the entire range.
### Components/Axes
* **Y-Axis:** Labeled "Throughput (TFLOP/S)". The scale is linear, ranging from 0 to 300, with major tick marks every 50 units.
* **X-Axis:** Labeled "n". The scale is logarithmic, with major tick marks at $2^8$, $2^{10}$, $2^{12}$, and $2^{14}$. The data series begins at approximately $2^7$.
* **Legend:** Positioned in the center-right area of the chart.
* **Blue line:** m=4, b=2048
* **Orange line:** m=2048, b=4
* **Green line:** m=8192, b=0
### Detailed Analysis
**Trend Verification:**
All three data series exhibit an identical trend:
1. **Growth Phase:** A steep, monotonic upward slope from $n \approx 2^7$ to $n \approx 2^{11}$.
2. **Saturation Phase:** A transition to a plateau starting around $n \approx 2^{12}$, where throughput stabilizes between 250 and 265 TFLOP/S.
3. **Stability:** From $n \approx 2^{13}$ to $n \approx 2^{15}$, the throughput remains relatively flat with minor fluctuations.
**Data Points (Approximate):**
| Input Size (n) | Throughput (TFLOP/S) |
| :--- | :--- |
| $2^7$ (128) | $\approx 25$ |
| $2^8$ (256) | $\approx 70$ |
| $2^9$ (512) | $\approx 125$ |
| $2^{10}$ (1024) | $\approx 175$ |
| $2^{11}$ (2048) | $\approx 220$ |
| $2^{12}$ (4096) | $\approx 240$ |
| $2^{13}$ (8192) | $\approx 260$ |
| $2^{15}$ (32768) | $\approx 255$ |
### Key Observations
* **Configuration Invariance:** The most significant observation is the near-perfect overlap of the blue, orange, and green lines. This indicates that the throughput is invariant to the specific combinations of 'm' and 'b' tested.
* **Performance Saturation:** The "knee" of the curve occurs between $n=2^{11}$ and $n=2^{12}$. Beyond this point, increasing the input size 'n' provides diminishing returns, suggesting the system has reached its peak computational capacity or memory bandwidth limit.
* **Minor Instability:** There is a slight, localized fluctuation (a small dip and recovery) around $n=2^{11}$, which is consistent across all three configurations.
### Interpretation
The data suggests that the underlying computational kernel is robust to the variations in parameters 'm' and 'b'. Whether 'm' and 'b' represent tiling factors, memory offsets, or batch sizes, they do not appear to be the primary bottleneck for this specific operation.
The saturation behavior is characteristic of compute-bound operations on hardware accelerators (like GPUs). At smaller 'n', the overhead of launching kernels or insufficient parallelism limits throughput. As 'n' increases, the hardware occupancy improves, leading to higher throughput. Once 'n' is large enough to fully saturate the compute units, throughput plateaus. The slight decline after the peak ($n > 2^{13}$) might indicate cache thrashing or increased memory management overhead as the problem size exceeds the optimal cache footprint.