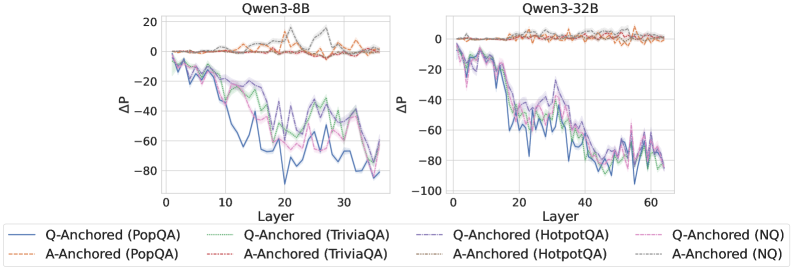
## Line Chart: Qwen3-8B and Qwen3-32B Performance
### Overview
The image presents two line charts comparing the performance of Qwen3-8B and Qwen3-32B models across different layers, measured by ΔP (Delta P). Each chart displays multiple data series, representing different question-answering datasets (PopQA, TriviaQA, HotpotQA, and NQ) anchored by either the question (Q-Anchored) or the answer (A-Anchored).
### Components/Axes
* **Titles:**
* Left Chart: Qwen3-8B
* Right Chart: Qwen3-32B
* **Y-Axis:**
* Label: ΔP
* Scale: -100 to 20, with increments of 20 (-80, -60, -40, -20, 0, 20)
* **X-Axis:**
* Label: Layer
* Left Chart Scale: 0 to 30, with increments of 10 (0, 10, 20, 30)
* Right Chart Scale: 0 to 60, with increments of 20 (0, 20, 40, 60)
* **Legend:** Located at the bottom of the image, describing the data series:
* Blue solid line: Q-Anchored (PopQA)
* Brown dashed line: A-Anchored (PopQA)
* Green dotted line: Q-Anchored (TriviaQA)
* Pink dashed-dotted line: A-Anchored (TriviaQA)
* Dark Blue dashed line: Q-Anchored (HotpotQA)
* Orange dotted line: A-Anchored (HotpotQA)
* Purple dashed-dotted line: Q-Anchored (NQ)
* Gray dotted line: A-Anchored (NQ)
### Detailed Analysis
#### Qwen3-8B (Left Chart)
* **Q-Anchored (PopQA) (Blue solid line):** Starts at approximately -5 and decreases to around -65 at layer 20, then fluctuates between -40 and -60 until layer 30.
* **A-Anchored (PopQA) (Brown dashed line):** Remains relatively stable around 0 to 5 across all layers.
* **Q-Anchored (TriviaQA) (Green dotted line):** Starts around -5 and decreases to approximately -40 at layer 15, then fluctuates between -30 and -40 until layer 30.
* **A-Anchored (TriviaQA) (Pink dashed-dotted line):** Starts around -5 and decreases to approximately -40 at layer 15, then fluctuates between -30 and -40 until layer 30.
* **Q-Anchored (HotpotQA) (Dark Blue dashed line):** Starts around -5 and decreases to approximately -50 at layer 15, then fluctuates between -40 and -50 until layer 30.
* **A-Anchored (HotpotQA) (Orange dotted line):** Remains relatively stable around 0 to 5 across all layers.
* **Q-Anchored (NQ) (Purple dashed-dotted line):** Starts around -5 and decreases to approximately -50 at layer 15, then fluctuates between -40 and -50 until layer 30.
* **A-Anchored (NQ) (Gray dotted line):** Remains relatively stable around 0 to 5 across all layers.
#### Qwen3-32B (Right Chart)
* **Q-Anchored (PopQA) (Blue solid line):** Starts at approximately -5 and decreases to around -85 at layer 40, then fluctuates between -70 and -80 until layer 60.
* **A-Anchored (PopQA) (Brown dashed line):** Remains relatively stable around 0 to 5 across all layers.
* **Q-Anchored (TriviaQA) (Green dotted line):** Starts around -5 and decreases to approximately -70 at layer 40, then fluctuates between -60 and -70 until layer 60.
* **A-Anchored (TriviaQA) (Pink dashed-dotted line):** Starts around -5 and decreases to approximately -70 at layer 40, then fluctuates between -60 and -70 until layer 60.
* **Q-Anchored (HotpotQA) (Dark Blue dashed line):** Starts around -5 and decreases to approximately -80 at layer 40, then fluctuates between -70 and -80 until layer 60.
* **A-Anchored (HotpotQA) (Orange dotted line):** Remains relatively stable around 0 to 5 across all layers.
* **Q-Anchored (NQ) (Purple dashed-dotted line):** Starts around -5 and decreases to approximately -80 at layer 40, then fluctuates between -70 and -80 until layer 60.
* **A-Anchored (NQ) (Gray dotted line):** Remains relatively stable around 0 to 5 across all layers.
### Key Observations
* **Performance Difference:** The Qwen3-32B model generally shows a greater decrease in ΔP compared to Qwen3-8B for Q-Anchored datasets.
* **Anchoring Impact:** A-Anchored datasets consistently maintain a ΔP close to 0 across all layers for both models.
* **Dataset Similarity:** The Q-Anchored datasets (TriviaQA, HotpotQA, NQ) exhibit similar trends within each model.
* **Layer Impact:** The most significant decrease in ΔP for Q-Anchored datasets occurs in the initial layers (up to layer 20 for Qwen3-8B and layer 40 for Qwen3-32B).
### Interpretation
The data suggests that anchoring by the question (Q-Anchored) leads to a performance decrease (as measured by ΔP) as the model processes deeper layers, especially for the larger Qwen3-32B model. This could indicate that the model's ability to utilize question-related information diminishes with increasing layer depth. Conversely, anchoring by the answer (A-Anchored) results in stable performance, suggesting that the model effectively retains answer-related information throughout its layers. The similarity in trends among different Q-Anchored datasets implies a consistent pattern in how the model processes question-based information across various question-answering tasks. The more significant performance drop in Qwen3-32B compared to Qwen3-8B for Q-Anchored datasets might indicate that the larger model is more sensitive to the way questions are processed across layers.