\n
## Diagram: Memory Subarray Timing Conflict
### Overview
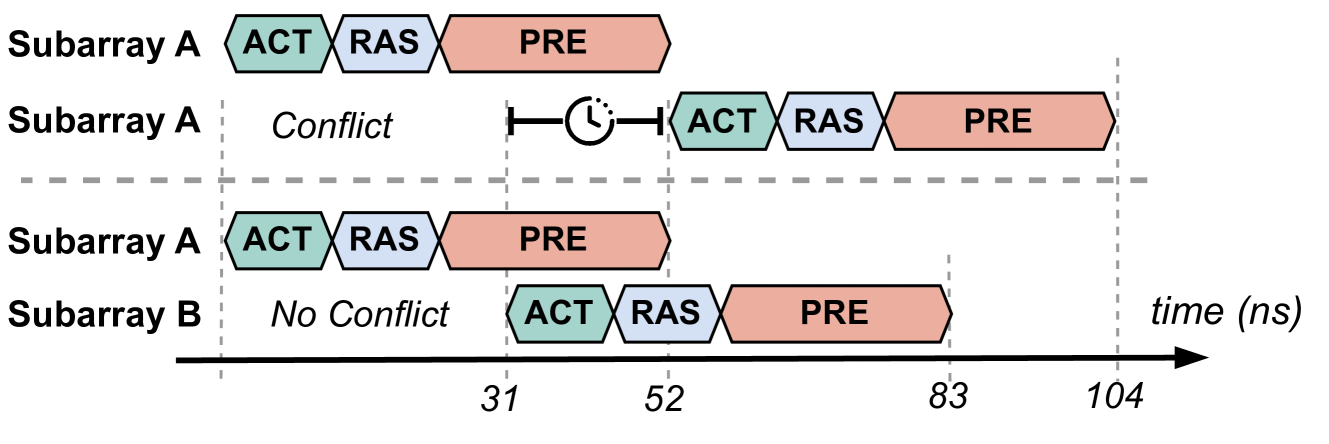
The image is a timing diagram illustrating a potential conflict between memory subarray accesses. It depicts the timing of ACT (Activate), RAS (Row Address Strobe), and PRE (Precharge) commands for two subarrays, A and B, over time. The diagram highlights a conflict scenario in the upper portion and a non-conflict scenario in the lower portion. The time axis is measured in nanoseconds (ns).
### Components/Axes
* **Y-axis:** Represents the subarrays, labeled "Subarray A" and "Subarray B".
* **X-axis:** Represents time, labeled "time (ns)", with markers at 31, 52, 83, and 104 ns.
* **Command Blocks:** Rectangular blocks represent the duration of each command:
* ACT (Activate) - Teal
* RAS (Row Address Strobe) - White
* PRE (Precharge) - Red/Brown
* **Labels:**
* "Conflict" - Indicates a timing conflict in the upper subarray A.
* "No Conflict" - Indicates no timing conflict in the lower subarray B.
* **Circular Arrow:** A circular arrow with opposing ends indicates the timing conflict.
### Detailed Analysis
The diagram shows the timing of ACT, RAS, and PRE commands for Subarray A in two scenarios, and Subarray B in one scenario.
**Subarray A (Conflict):**
* ACT starts at approximately 0 ns and ends around 15 ns.
* RAS starts at approximately 15 ns and ends around 31 ns.
* PRE starts at approximately 31 ns and ends around 52 ns.
* A second ACT starts at approximately 52 ns and ends around 67 ns.
* A second RAS starts at approximately 67 ns and ends around 83 ns.
* A second PRE starts at approximately 83 ns and ends around 104 ns.
**Subarray A (No Conflict):**
* ACT starts at approximately 0 ns and ends around 15 ns.
* RAS starts at approximately 15 ns and ends around 31 ns.
* PRE starts at approximately 31 ns and ends around 52 ns.
**Subarray B (No Conflict):**
* ACT starts at approximately 31 ns and ends around 46 ns.
* RAS starts at approximately 46 ns and ends around 62 ns.
* PRE starts at approximately 62 ns and ends around 83 ns.
The conflict is visually represented by the overlapping PRE command of the first cycle of Subarray A with the ACT command of the second cycle.
### Key Observations
* The conflict occurs when the PRE command of the first access overlaps with the ACT command of the subsequent access in Subarray A.
* Subarray B demonstrates a timing sequence that avoids this conflict.
* The diagram clearly illustrates the importance of timing in memory access to prevent conflicts.
### Interpretation
The diagram demonstrates a potential timing conflict in memory subarray access. The conflict arises when a precharge operation (PRE) for one row overlaps with an activate operation (ACT) for another row within the same subarray. This conflict can lead to data corruption or incorrect memory operation. The lower portion of the diagram shows how staggering the timing of accesses in Subarray B avoids the conflict. This suggests that careful scheduling of memory operations is crucial for maintaining data integrity and system stability. The diagram is a simplified representation of a complex process, likely used to illustrate a specific timing issue in memory controller design or analysis. The use of distinct colors for each command (ACT, RAS, PRE) aids in visualizing the timing relationships and identifying potential conflicts. The diagram is a clear and concise way to communicate a critical timing constraint in memory systems.