## Chart: Delta P vs Layer for Qwen3 Models
### Overview
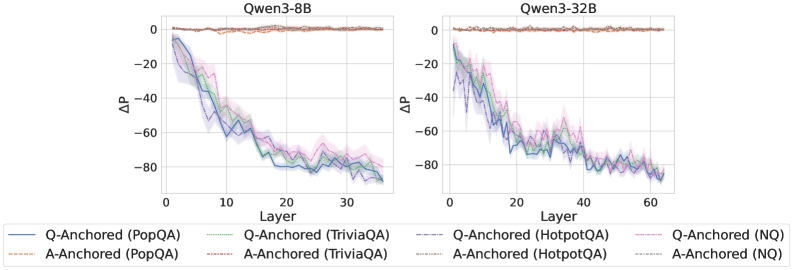
The image presents two line charts comparing the change in probability (ΔP) across different layers of two Qwen3 models: Qwen3-8B and Qwen3-32B. The x-axis represents the layer number, and the y-axis represents ΔP. Each chart displays six data series, representing different question-answering datasets (PopQA, TriviaQA, HotpotQA, and NQ) anchored by either the question (Q-Anchored) or the answer (A-Anchored).
### Components/Axes
* **Titles:**
* Left Chart: Qwen3-8B
* Right Chart: Qwen3-32B
* **X-Axis (Layer):**
* Left Chart: 0 to 30, incrementing by 10.
* Right Chart: 0 to 60, incrementing by 20.
* **Y-Axis (ΔP):**
* Both Charts: -80 to 0, incrementing by 20.
* **Legend (Bottom):**
* Q-Anchored (PopQA): Solid Blue Line
* A-Anchored (PopQA): Dashed Brown Line
* Q-Anchored (TriviaQA): Dotted Green Line
* A-Anchored (TriviaQA): Dash-Dotted Gray Line
* Q-Anchored (HotpotQA): Dash-Dotted Purple Line
* A-Anchored (HotpotQA): Dotted Gray Line
* Q-Anchored (NQ): Dash-Dotted Purple Line
* A-Anchored (NQ): Dotted Gray Line
### Detailed Analysis
**Left Chart (Qwen3-8B):**
* **Q-Anchored (PopQA) - Solid Blue Line:** Starts at approximately -5 at Layer 0, decreases sharply to approximately -70 by Layer 10, and then plateaus around -75 to -80 for the remaining layers.
* **A-Anchored (PopQA) - Dashed Brown Line:** Remains relatively constant around 0 throughout all layers.
* **Q-Anchored (TriviaQA) - Dotted Green Line:** Starts at approximately -10 at Layer 0, decreases to approximately -70 by Layer 10, and then plateaus around -70 to -75 for the remaining layers.
* **A-Anchored (TriviaQA) - Dash-Dotted Gray Line:** Starts at approximately -15 at Layer 0, decreases to approximately -70 by Layer 10, and then plateaus around -70 to -75 for the remaining layers.
* **Q-Anchored (HotpotQA) - Dash-Dotted Purple Line:** Starts at approximately -15 at Layer 0, decreases to approximately -70 by Layer 10, and then plateaus around -70 to -75 for the remaining layers.
* **A-Anchored (HotpotQA) - Dotted Gray Line:** Starts at approximately -15 at Layer 0, decreases to approximately -70 by Layer 10, and then plateaus around -70 to -75 for the remaining layers.
* **Q-Anchored (NQ) - Dash-Dotted Purple Line:** Starts at approximately -15 at Layer 0, decreases to approximately -70 by Layer 10, and then plateaus around -70 to -75 for the remaining layers.
* **A-Anchored (NQ) - Dotted Gray Line:** Starts at approximately -15 at Layer 0, decreases to approximately -70 by Layer 10, and then plateaus around -70 to -75 for the remaining layers.
**Right Chart (Qwen3-32B):**
* **Q-Anchored (PopQA) - Solid Blue Line:** Starts at approximately -10 at Layer 0, decreases sharply to approximately -75 by Layer 20, and then plateaus around -75 to -80 for the remaining layers.
* **A-Anchored (PopQA) - Dashed Brown Line:** Remains relatively constant around 0 throughout all layers.
* **Q-Anchored (TriviaQA) - Dotted Green Line:** Starts at approximately -15 at Layer 0, decreases to approximately -70 by Layer 20, and then plateaus around -70 to -75 for the remaining layers.
* **A-Anchored (TriviaQA) - Dash-Dotted Gray Line:** Starts at approximately -15 at Layer 0, decreases to approximately -70 by Layer 20, and then plateaus around -70 to -75 for the remaining layers.
* **Q-Anchored (HotpotQA) - Dash-Dotted Purple Line:** Starts at approximately -15 at Layer 0, decreases to approximately -70 by Layer 20, and then plateaus around -70 to -75 for the remaining layers.
* **A-Anchored (HotpotQA) - Dotted Gray Line:** Starts at approximately -15 at Layer 0, decreases to approximately -70 by Layer 20, and then plateaus around -70 to -75 for the remaining layers.
* **Q-Anchored (NQ) - Dash-Dotted Purple Line:** Starts at approximately -15 at Layer 0, decreases to approximately -70 by Layer 20, and then plateaus around -70 to -75 for the remaining layers.
* **A-Anchored (NQ) - Dotted Gray Line:** Starts at approximately -15 at Layer 0, decreases to approximately -70 by Layer 20, and then plateaus around -70 to -75 for the remaining layers.
### Key Observations
* For both models, A-Anchored (PopQA) remains consistently near 0 across all layers, indicating minimal change in probability.
* For both models, the Q-Anchored data series (PopQA, TriviaQA, HotpotQA, and NQ) show a significant decrease in ΔP in the initial layers, indicating a substantial change in probability.
* The Qwen3-32B model shows a more gradual decrease in ΔP compared to the Qwen3-8B model.
* The shaded regions around each line represent the uncertainty or variance in the data.
### Interpretation
The charts suggest that anchoring the question (Q-Anchored) leads to a more significant change in probability (ΔP) compared to anchoring the answer (A-Anchored), especially for the PopQA dataset. The A-Anchored (PopQA) data series remaining near 0 indicates that the model's probability doesn't change much when the answer is anchored. The decrease in ΔP for Q-Anchored series suggests that the model's probability changes significantly as it processes the question through different layers.
The Qwen3-32B model, with its larger size, exhibits a more gradual change in ΔP, possibly indicating a more refined and distributed learning process across its layers compared to the smaller Qwen3-8B model. The plateauing of ΔP after a certain number of layers suggests that the models reach a stable state in their probability estimation.