## Line Chart: Performance vs. Recurrence at Test-Time
### Overview
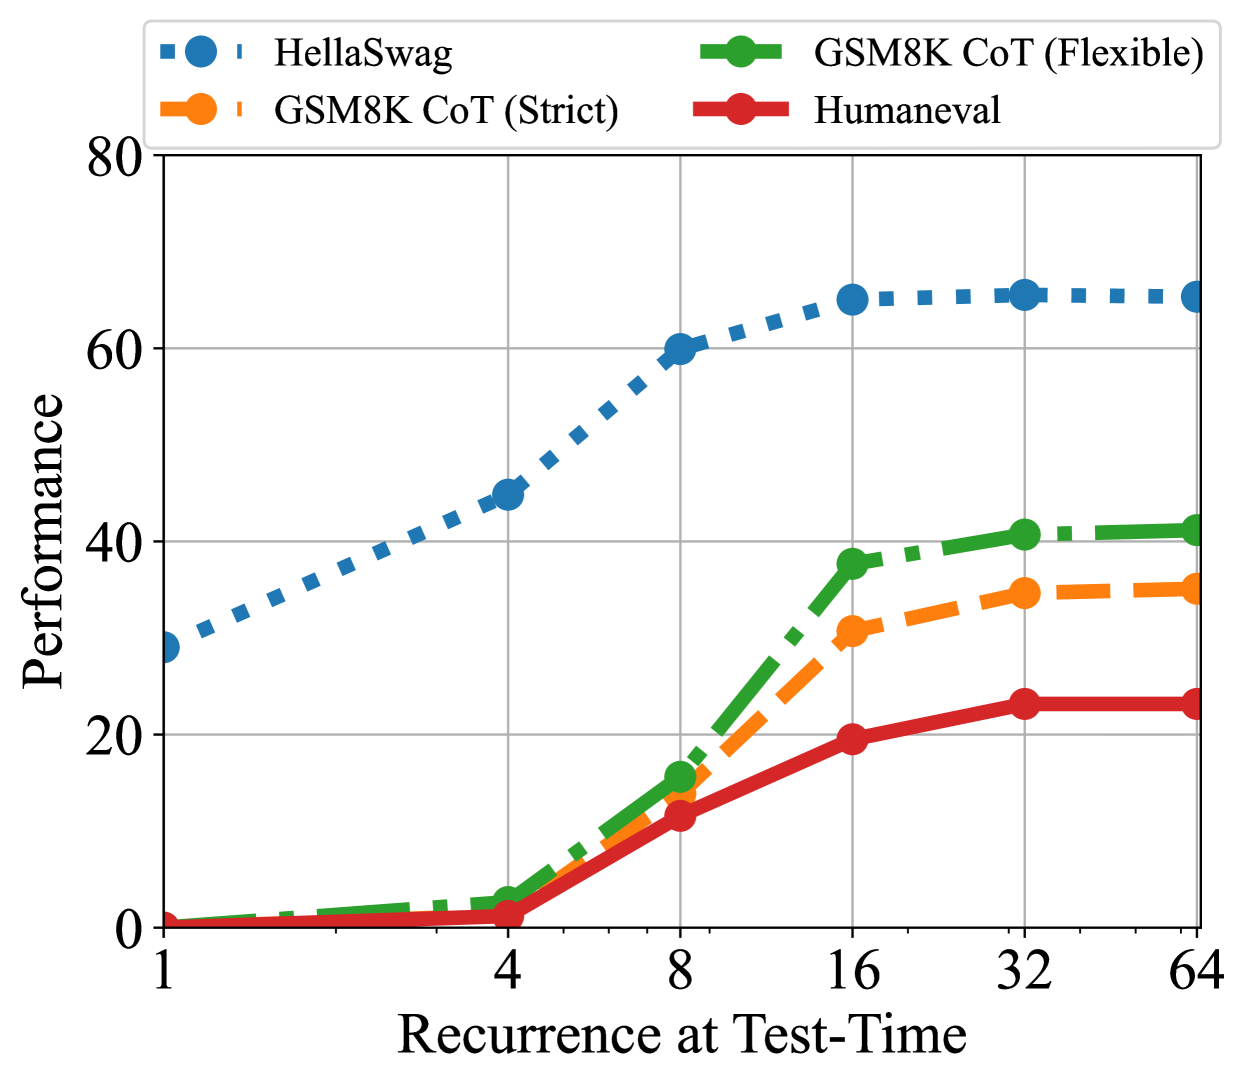
The image is a line chart comparing the performance of four different models (HellaSwag, GSM8K CoT (Strict), GSM8K CoT (Flexible), and Humaneval) across varying levels of recurrence at test-time. The x-axis represents the recurrence at test-time, while the y-axis represents performance.
### Components/Axes
* **X-axis:** Recurrence at Test-Time, with values 1, 4, 8, 16, 32, and 64.
* **Y-axis:** Performance, with values ranging from 0 to 80.
* **Legend (top-left):**
* Blue squares: HellaSwag
* Orange circles: GSM8K CoT (Strict)
* Green circles: GSM8K CoT (Flexible)
* Red line: Humaneval
### Detailed Analysis
* **HellaSwag (Blue, dotted line):** The performance increases sharply from a recurrence of 1 to 8, then plateaus.
* Recurrence 1: Performance ~30
* Recurrence 4: Performance ~45
* Recurrence 8: Performance ~60
* Recurrence 16: Performance ~65
* Recurrence 32: Performance ~65
* Recurrence 64: Performance ~65
* **GSM8K CoT (Strict) (Orange, dashed line):** The performance increases gradually with recurrence.
* Recurrence 1: Performance ~0
* Recurrence 4: Performance ~2
* Recurrence 8: Performance ~10
* Recurrence 16: Performance ~30
* Recurrence 32: Performance ~35
* Recurrence 64: Performance ~35
* **GSM8K CoT (Flexible) (Green, dashed-dotted line):** The performance increases with recurrence, similar to the strict version, but with a steeper initial increase.
* Recurrence 1: Performance ~0
* Recurrence 4: Performance ~2
* Recurrence 8: Performance ~15
* Recurrence 16: Performance ~40
* Recurrence 32: Performance ~40
* Recurrence 64: Performance ~42
* **Humaneval (Red, solid line):** The performance increases gradually with recurrence, but remains lower than the other models.
* Recurrence 1: Performance ~0
* Recurrence 4: Performance ~2
* Recurrence 8: Performance ~10
* Recurrence 16: Performance ~20
* Recurrence 32: Performance ~23
* Recurrence 64: Performance ~23
### Key Observations
* HellaSwag significantly outperforms the other models, especially at lower recurrence values.
* GSM8K CoT (Flexible) generally performs better than GSM8K CoT (Strict).
* Humaneval has the lowest performance across all recurrence values.
* All models except HellaSwag show a noticeable increase in performance as recurrence increases from 1 to 16.
### Interpretation
The chart suggests that increasing recurrence at test-time can improve the performance of these models, particularly for GSM8K CoT (Strict), GSM8K CoT (Flexible), and Humaneval. HellaSwag, however, reaches a performance plateau relatively quickly. The substantial difference in performance between HellaSwag and the other models indicates that it may be better suited for tasks requiring fewer recurrent steps. The difference between the strict and flexible versions of GSM8K CoT suggests that allowing more flexibility in the chain-of-thought reasoning can lead to better performance. Humaneval's lower performance may indicate that it is a more challenging task or that the model is not as well-suited for recurrent processing.