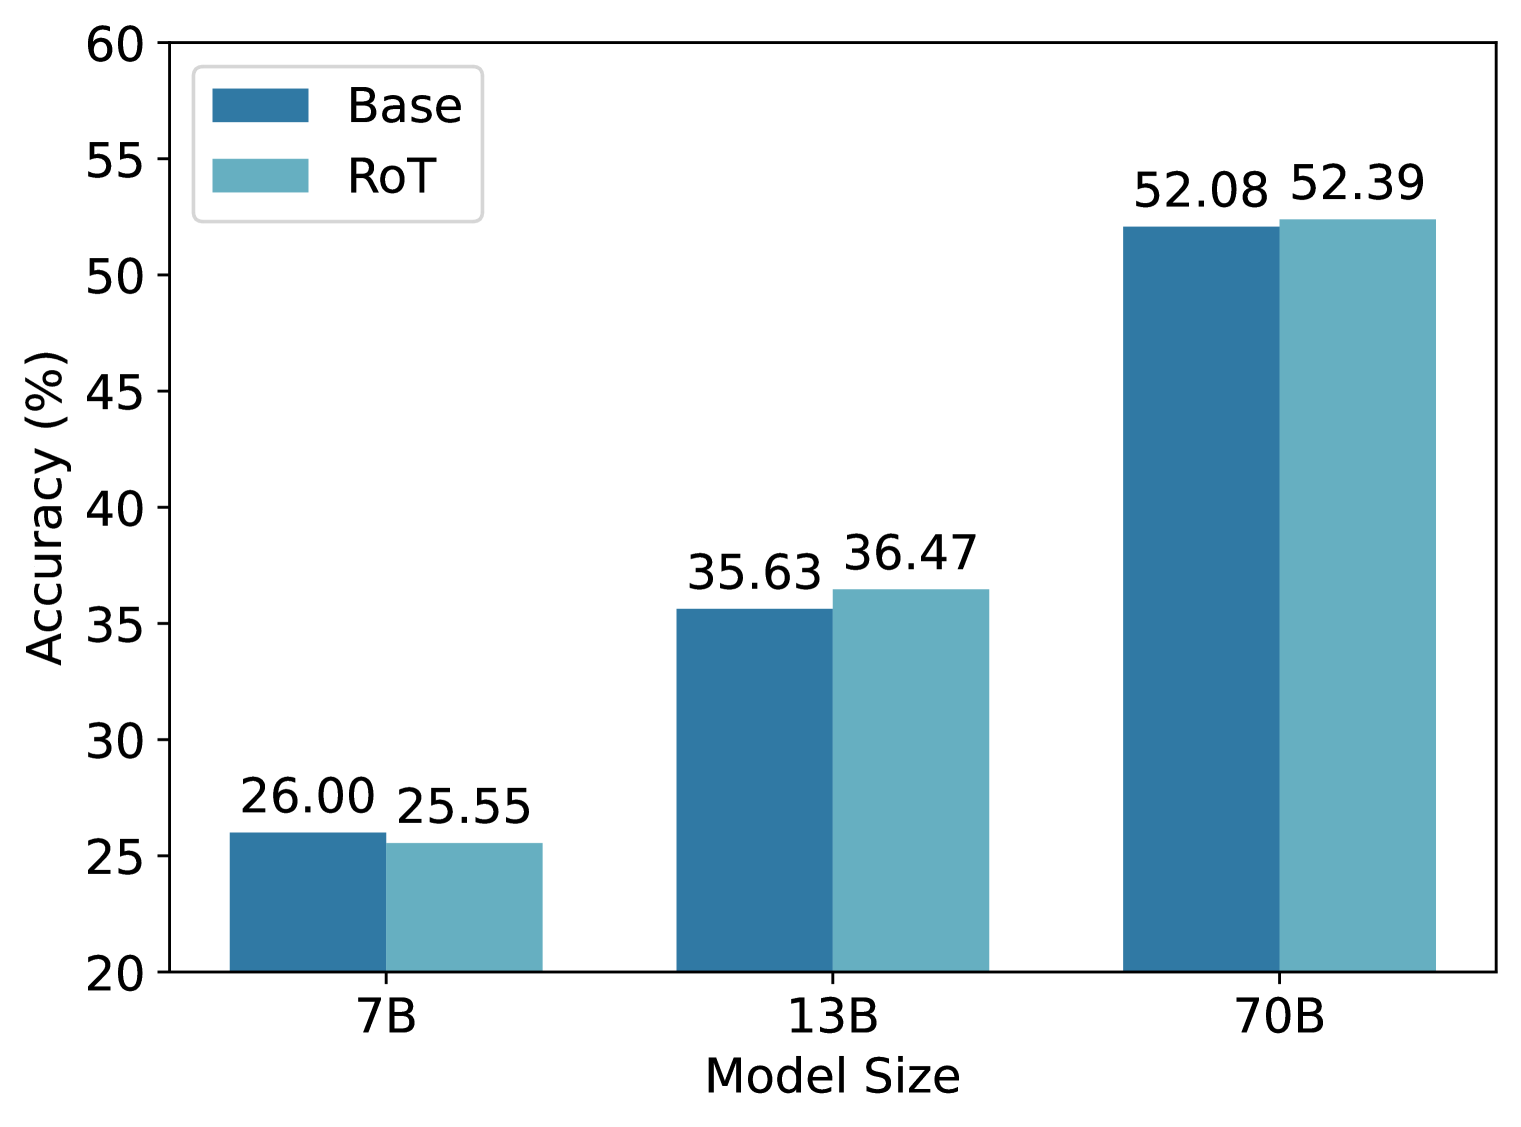
## Grouped Bar Chart: Model Accuracy vs. Model Size
### Overview
The image displays a grouped bar chart comparing the accuracy (in percentage) of two model variants, "Base" and "RoT," across three different model sizes. The chart demonstrates a clear positive correlation between model size and accuracy for both variants.
### Components/Axes
* **Chart Type:** Grouped Bar Chart.
* **Y-Axis:** Labeled "Accuracy (%)". The scale runs from 20 to 60, with major tick marks at intervals of 5 (20, 25, 30, 35, 40, 45, 50, 55, 60).
* **X-Axis:** Labeled "Model Size". It contains three categorical groups: "7B", "13B", and "70B".
* **Legend:** Located in the top-left corner of the chart area.
* A dark blue square is labeled "Base".
* A light blue (teal) square is labeled "RoT".
* **Data Labels:** Numerical accuracy values are printed directly above each bar.
### Detailed Analysis
The chart presents paired bars for each model size category. The left bar in each pair is dark blue ("Base"), and the right bar is light blue ("RoT").
**1. Model Size: 7B**
* **Base (Dark Blue):** Accuracy = 26.00%
* **RoT (Light Blue):** Accuracy = 25.55%
* **Trend:** The "Base" model performs slightly better than the "RoT" model at this size, with a difference of 0.45 percentage points.
**2. Model Size: 13B**
* **Base (Dark Blue):** Accuracy = 35.63%
* **RoT (Light Blue):** Accuracy = 36.47%
* **Trend:** Both models show a significant accuracy increase from the 7B size. The "RoT" model now performs slightly better than the "Base" model, with a difference of 0.84 percentage points.
**3. Model Size: 70B**
* **Base (Dark Blue):** Accuracy = 52.08%
* **RoT (Light Blue):** Accuracy = 52.39%
* **Trend:** This is the highest accuracy achieved by both models. The performance gap between them is very narrow, with "RoT" leading by only 0.31 percentage points.
### Key Observations
* **Dominant Trend:** Accuracy increases substantially with model size for both "Base" and "RoT" variants. The jump from 7B to 13B is large (~10 percentage points), and the jump from 13B to 70B is even larger (~16-17 percentage points).
* **Performance Relationship:** The relative performance of "Base" vs. "RoT" flips between the smallest and the larger models. "Base" is marginally better at 7B, while "RoT" is marginally better at 13B and 70B.
* **Diminishing Relative Difference:** The absolute difference in accuracy between the two variants is small at all sizes (less than 1 percentage point) and appears to narrow as model size increases.
### Interpretation
The data suggests that **model scale is the primary driver of performance** on the evaluated task, with larger models (70B) achieving roughly double the accuracy of the smallest models (7B). The "RoT" variant (which may stand for a technique like "Rule of Thumb" or another modification) does not provide a dramatic accuracy improvement over the "Base" model. Its effect is minimal and inconsistent at the smallest scale, becoming slightly positive at larger scales. This implies that the benefit of the "RoT" method, if any, is marginal and may only manifest or become stable with sufficient model capacity. The chart effectively communicates that investing in larger model sizes yields far more significant accuracy gains than switching from the "Base" to the "RoT" variant for this particular benchmark.