TECHNICAL ASSET FINGERPRINT
b41a06e753c7c30871b8f6f8
Click to view fullscreen
Press ESC or click to close
FOUND IN PAPERS
EXPERT: healer-alpha-free VERSION 1
RUNTIME: free/openrouter/healer-alpha
INTEL_VERIFIED
## [Dual Charts]: Training Data Efficiency and Verifier-Guided Search Performance
### Overview
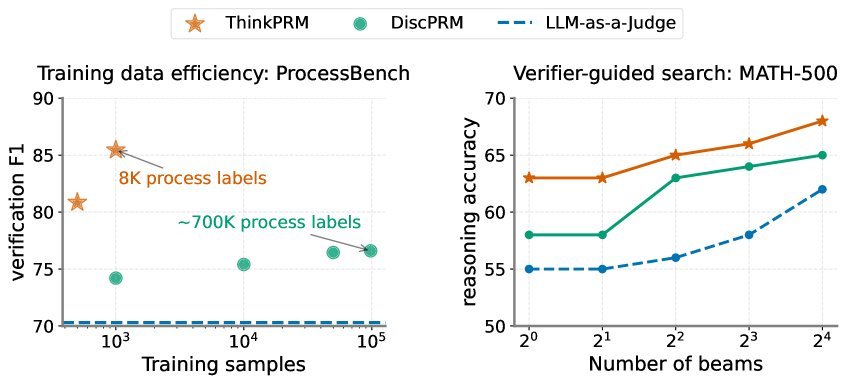
The image displays two side-by-side charts comparing the performance of three methods: **ThinkPRM** (orange star markers), **DiscPRM** (green circle markers), and **LLM-as-a-Judge** (blue dashed line). The left chart evaluates training data efficiency on the ProcessBench dataset, while the right chart evaluates reasoning accuracy on the MATH-500 dataset using verifier-guided search with varying numbers of beams. A shared legend is positioned at the top center of the entire figure.
### Components/Axes
**Shared Legend (Top Center):**
* **ThinkPRM**: Represented by an orange star (★) marker.
* **DiscPRM**: Represented by a green circle (●) marker.
* **LLM-as-a-Judge**: Represented by a blue dashed line (---).
**Left Chart: "Training data efficiency: ProcessBench"**
* **Y-axis (Vertical):** Label: "verification F1". Scale: Linear, ranging from 70 to 90, with major ticks at 70, 75, 80, 85, 90.
* **X-axis (Horizontal):** Label: "Training samples". Scale: Logarithmic (base 10), with major ticks at 10³, 10⁴, 10⁵.
* **Annotations:**
* An arrow points to the ThinkPRM data point at approximately 10³ samples with the text: "8K process labels" (in orange).
* An arrow points to the DiscPRM data point at approximately 10⁵ samples with the text: "~700K process labels" (in green).
**Right Chart: "Verifier-guided search: MATH-500"**
* **Y-axis (Vertical):** Label: "reasoning accuracy". Scale: Linear, ranging from 50 to 70, with major ticks at 50, 55, 60, 65, 70.
* **X-axis (Horizontal):** Label: "Number of beams". Scale: Logarithmic (base 2), with major ticks at 2⁰, 2¹, 2², 2³, 2⁴ (corresponding to 1, 2, 4, 8, 16 beams).
### Detailed Analysis
**Left Chart - Training Data Efficiency (ProcessBench):**
* **ThinkPRM (Orange Stars):** Shows a high verification F1 score with very little training data. The first point at ~10³ samples has an F1 of ~81. The second point, annotated as using "8K process labels" (which is less than 10⁴ samples), achieves the highest F1 on the chart at ~85.5. The trend suggests exceptional data efficiency.
* **DiscPRM (Green Circles):** Requires significantly more data to achieve moderate performance. The first point at ~10³ samples has an F1 of ~74. Performance increases gradually with more data: ~75.5 at 10⁴ samples, and ~76.5 at the point annotated as using "~700K process labels" (near 10⁵ samples).
* **LLM-as-a-Judge (Blue Dashed Line):** Appears as a flat, horizontal line at an F1 score of approximately 70 across the entire range of training samples (10³ to 10⁵). This indicates its performance is static and does not improve with the addition of the specific training data measured here.
**Right Chart - Verifier-Guided Search (MATH-500):**
* **ThinkPRM (Orange Stars):** Demonstrates the highest reasoning accuracy at every beam count. The trend is consistently upward: starting at ~63% accuracy for 1 beam (2⁰), rising to ~63% for 2 beams (2¹), ~65% for 4 beams (2²), ~66% for 8 beams (2³), and peaking at ~68% for 16 beams (2⁴).
* **DiscPRM (Green Circles):** Shows a similar upward trend but at a lower accuracy level than ThinkPRM. Starts at ~58% for 1 beam, remains at ~58% for 2 beams, jumps to ~63% for 4 beams, increases to ~64% for 8 beams, and reaches ~65% for 16 beams.
* **LLM-as-a-Judge (Blue Dashed Line):** Has the lowest accuracy but also shows a clear improving trend with more beams. Starts at ~55% for 1 and 2 beams, increases to ~56% for 4 beams, ~58% for 8 beams, and ends at ~62% for 16 beams.
### Key Observations
1. **Dominant Performance:** ThinkPRM outperforms both DiscPRM and LLM-as-a-Judge on both metrics (verification F1 and reasoning accuracy) across all data points and beam counts shown.
2. **Data Efficiency Disparity:** The left chart highlights a massive difference in data efficiency. ThinkPRM achieves its peak performance with only ~8K process labels, while DiscPRM uses ~700K labels to reach a lower F1 score.
3. **Positive Scaling with Search Effort:** All three methods in the right chart show improved reasoning accuracy as the "Number of beams" (a proxy for search effort or computation) increases from 1 to 16.
4. **Performance Hierarchy:** A consistent performance hierarchy is maintained in the right chart: ThinkPRM > DiscPRM > LLM-as-a-Judge at every beam count.
5. **Baseline Comparison:** The LLM-as-a-Judge serves as a baseline. In the left chart, it is static, while in the right chart, it improves but remains the lowest-performing method.
### Interpretation
The data suggests that **ThinkPRM is a significantly more data-efficient and effective verification/reasoning method** compared to DiscPRM and a standard LLM-as-a-Judge approach.
* **For Training Efficiency (ProcessBench):** The key insight is that ThinkPRM's architecture or training paradigm allows it to learn a high-quality verification function from a very small, targeted set of process labels (8K). In contrast, DiscPRM requires nearly two orders of magnitude more data (~700K) to learn a less effective verifier. This implies ThinkPRM has a much better inductive bias for this task.
* **For Search-Guided Reasoning (MATH-500):** The results demonstrate that using a better verifier (ThinkPRM) directly translates to higher final answer accuracy when guiding a search process (like beam search). The upward trend for all methods confirms that allocating more compute (more beams) to the search is beneficial, but the quality of the verifier (the "guide") sets the ceiling for potential accuracy. ThinkPRM provides a better guide, leading to superior outcomes at every compute budget.
**Notable Anomaly/Outlier:** The flat line for LLM-as-a-Judge in the left chart is striking. It suggests that the specific "training samples" being varied on the x-axis (likely process labels for training a dedicated verifier) are irrelevant to the LLM-as-a-Judge method, which presumably uses a pre-trained LLM without this specific fine-tuning. Its performance is therefore constant with respect to this variable.
**Underlying Message:** The charts collectively argue for the value of developing specialized, data-efficient process reward models (like ThinkPRM) over both larger, less efficient models (DiscPRM) and general-purpose LLM judges for tasks requiring step-by-step verification and guided reasoning, particularly in domains like mathematical problem-solving.
DECODING INTELLIGENCE...