## Line Chart: Step Length vs Reasoning Tokens for Zero Shot Easy Blocksworld
### Overview
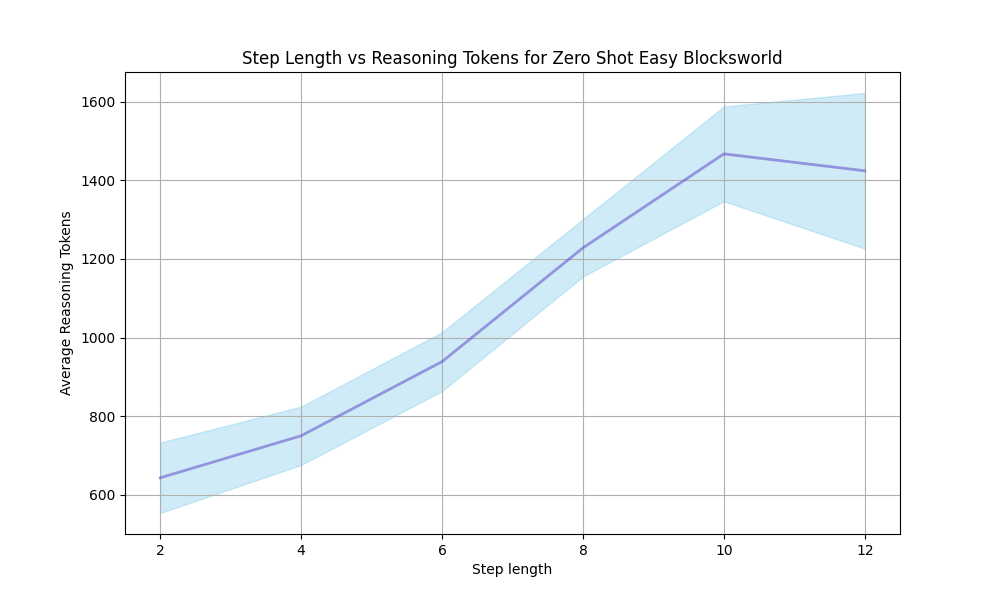
The chart visualizes the relationship between step length (x-axis) and average reasoning tokens (y-axis) for a zero-shot "Easy Blocksworld" task. A blue line represents the average reasoning tokens, with a shaded blue region indicating variability (±100 tokens). The data shows a general upward trend with a slight plateau at higher step lengths.
### Components/Axes
- **X-axis (Step length)**: Labeled "Step length" with integer ticks at 2, 4, 6, 8, 10, and 12.
- **Y-axis (Average Reasoning Tokens)**: Labeled "Average Reasoning Tokens" with increments of 200 from 600 to 1600.
- **Legend**: Located in the top-right corner, with:
- **Blue line**: "Average" (solid line).
- **Shaded blue area**: "±100 tokens" (range around the average).
### Detailed Analysis
1. **Data Points**:
- At step length 2: ~640 tokens (blue line).
- At step length 4: ~750 tokens.
- At step length 6: ~930 tokens.
- At step length 8: ~1200 tokens.
- At step length 10: ~1460 tokens (peak).
- At step length 12: ~1420 tokens (slight decline).
2. **Shaded Region**:
- The ±100 token range creates a band around the blue line, e.g., at step length 10, the range spans ~1360–1560 tokens.
3. **Trends**:
- The blue line slopes upward from step length 2 to 10, then flattens slightly at 12.
- The shaded region widens slightly at higher step lengths (e.g., 10–12), suggesting increased variability.
### Key Observations
- **Upward Trend**: Reasoning tokens increase with step length up to 10, then plateau.
- **Peak Efficiency**: Step length 10 achieves the highest average tokens (~1460).
- **Variability**: The shaded region indicates consistent ±100 token variability across all step lengths.
- **Slight Decline**: At step length 12, the average drops slightly (~1420), but remains within the ±100 range of the peak.
### Interpretation
The data suggests that increasing step length improves reasoning token efficiency up to a point (step length 10), after which gains diminish. The shaded region implies that the model's performance is relatively stable, with minor fluctuations. The slight decline at step length 12 may indicate diminishing returns or task-specific constraints. This trend could inform optimization strategies for balancing computational cost (step length) and reasoning quality (tokens).