\n
## Bar Chart: Blind Spot Summary Across Datasets - 95% Confidence Intervals
### Overview
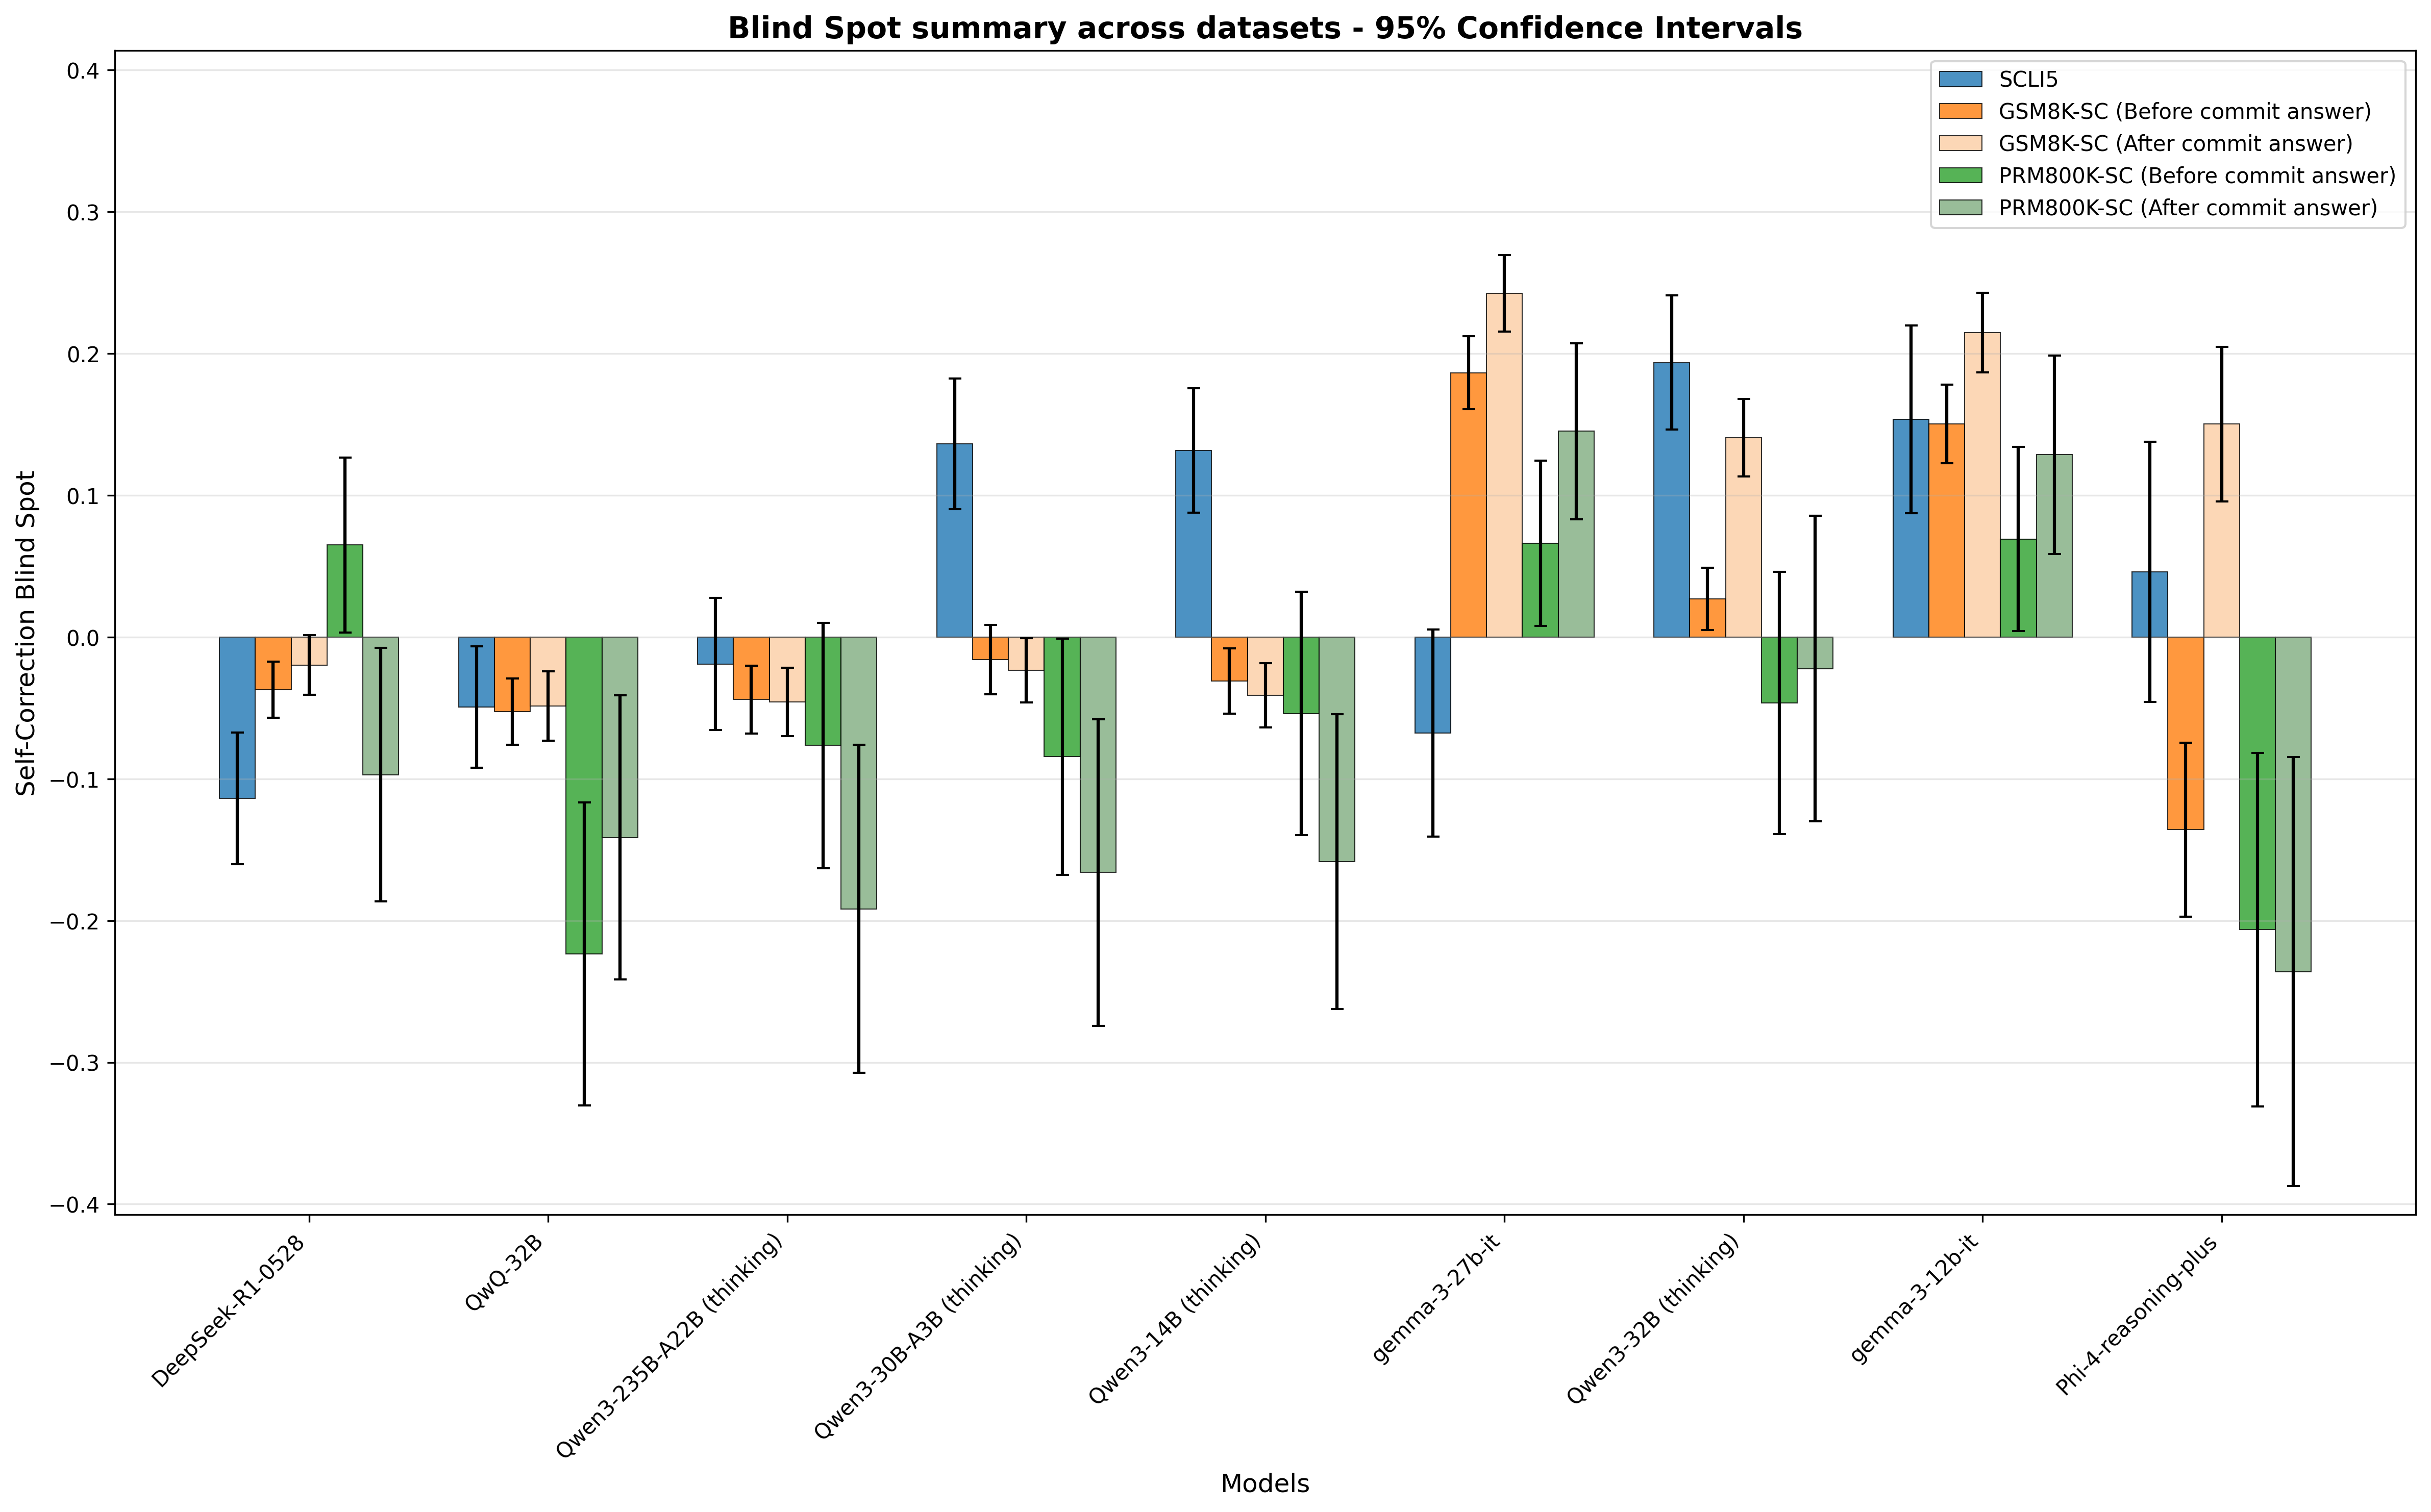
This bar chart visualizes the "Self-Correction Blind Spot" across different models, with 95% confidence intervals represented by error bars. The chart compares the blind spot for models before and after a "commit answer" step. The x-axis represents the models, and the y-axis represents the Self-Correction Blind Spot value.
### Components/Axes
* **Title:** Blind Spot summary across datasets - 95% Confidence Intervals
* **X-axis Label:** Models
* **Y-axis Label:** Self-Correction Blind Spot
* **Legend:**
* SCLIS (Purple)
* GSM8K-SC (Before commit answer) (Blue)
* GSM8K-SC (After commit answer) (Orange)
* PRM800K-SC (Before commit answer) (Green)
* PRM800K-SC (After commit answer) (Gray)
* **Models (X-axis categories):** DeepSeek-RL-0.5B, Qwk-32B, Owen-3-25B-A2B (thinking), Owen-3-30B-A3B (thinking), Owen-3-14B (thinking), gemma-3-27b, Owen-3-32B (thinking), gemma-3-12b, Phi-4-reasoning-plus
* **Y-axis Scale:** Ranges from approximately -0.4 to 0.4.
### Detailed Analysis
The chart displays bar groupings for each model, representing the Self-Correction Blind Spot for each condition (SCLIS, GSM8K-SC before/after, PRM800K-SC before/after). Each bar has an associated error bar indicating the 95% confidence interval.
Here's a breakdown of the approximate values, reading from left to right:
* **DeepSeek-RL-0.5B:**
* SCLIS: ~0.02
* GSM8K-SC (Before): ~0.03
* GSM8K-SC (After): ~0.01
* PRM800K-SC (Before): ~0.01
* PRM800K-SC (After): ~0.00
* **Qwk-32B:**
* SCLIS: ~0.01
* GSM8K-SC (Before): ~0.01
* GSM8K-SC (After): ~-0.02
* PRM800K-SC (Before): ~-0.01
* PRM800K-SC (After): ~-0.02
* **Owen-3-25B-A2B (thinking):**
* SCLIS: ~0.01
* GSM8K-SC (Before): ~0.04
* GSM8K-SC (After): ~0.02
* PRM800K-SC (Before): ~0.02
* PRM800K-SC (After): ~0.01
* **Owen-3-30B-A3B (thinking):**
* SCLIS: ~0.01
* GSM8K-SC (Before): ~0.06
* GSM8K-SC (After): ~0.03
* PRM800K-SC (Before): ~0.03
* PRM800K-SC (After): ~0.02
* **Owen-3-14B (thinking):**
* SCLIS: ~0.00
* GSM8K-SC (Before): ~0.03
* GSM8K-SC (After): ~0.01
* PRM800K-SC (Before): ~0.01
* PRM800K-SC (After): ~0.00
* **gemma-3-27b:**
* SCLIS: ~0.01
* GSM8K-SC (Before): ~0.03
* GSM8K-SC (After): ~0.01
* PRM800K-SC (Before): ~0.01
* PRM800K-SC (After): ~0.00
* **Owen-3-32B (thinking):**
* SCLIS: ~0.01
* GSM8K-SC (Before): ~0.04
* GSM8K-SC (After): ~0.02
* PRM800K-SC (Before): ~0.02
* PRM800K-SC (After): ~0.01
* **gemma-3-12b:**
* SCLIS: ~0.01
* GSM8K-SC (Before): ~0.05
* GSM8K-SC (After): ~0.03
* PRM800K-SC (Before): ~0.03
* PRM800K-SC (After): ~0.02
* **Phi-4-reasoning-plus:**
* SCLIS: ~0.02
* GSM8K-SC (Before): ~0.06
* GSM8K-SC (After): ~0.04
* PRM800K-SC (Before): ~0.04
* PRM800K-SC (After): ~0.03
**Trends:**
* For GSM8K-SC, the "After commit answer" generally shows a decrease in the Self-Correction Blind Spot compared to "Before commit answer," suggesting the commit step helps reduce blind spots.
* PRM800K-SC shows a similar, but less pronounced, trend.
* SCLIS values are generally low and relatively consistent across models.
### Key Observations
* The models "Owen-3-30B-A3B (thinking)", "gemma-3-12b", and "Phi-4-reasoning-plus" exhibit the largest positive Self-Correction Blind Spot values for GSM8K-SC (Before commit answer).
* The error bars indicate varying degrees of uncertainty in the estimates. Some models have wider confidence intervals than others.
* Qwk-32B shows a negative blind spot after the commit answer for GSM8K-SC, which is an outlier.
### Interpretation
The chart demonstrates the impact of a "commit answer" step on the self-correction capabilities of different language models. The reduction in the Self-Correction Blind Spot after the commit step for GSM8K-SC suggests that this process helps models identify and correct their own errors. The differences in blind spot values across models indicate varying levels of inherent self-awareness and correction ability. The negative blind spot for Qwk-32B after the commit answer is an interesting anomaly that warrants further investigation – it could indicate an overcorrection or a different interpretation of the task. The consistent, low values for SCLIS suggest it may be a different metric or operate on a different scale than the GSM8K-SC and PRM800K-SC metrics. The confidence intervals provide a measure of the reliability of these observations, highlighting the need for caution when interpreting differences between models with large intervals.