\n
## Diagram: Acute Coronary Syndrome (ACS) Diagnostic Pathway
### Overview
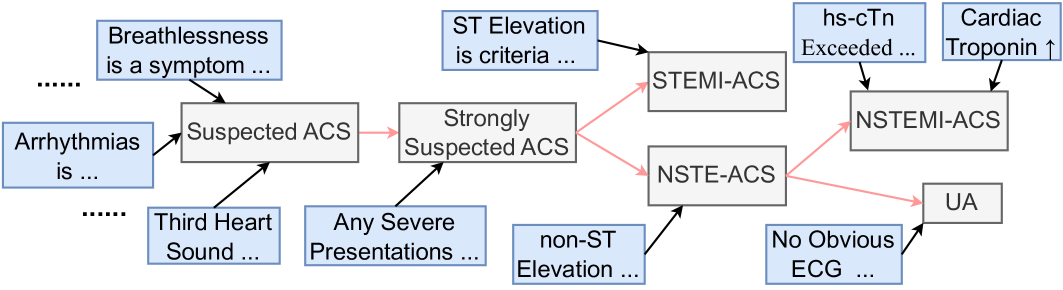
The image depicts a flowchart illustrating a diagnostic pathway for Acute Coronary Syndrome (ACS). It outlines the progression from initial symptoms and findings to different classifications of ACS, based on criteria like ST elevation, troponin levels, and ECG results. The diagram uses rectangular boxes to represent diagnostic categories or findings, and arrows to indicate the flow of assessment and diagnosis.
### Components/Axes
The diagram does not have traditional axes. It consists of interconnected boxes representing clinical states and findings. The flow is directional, indicated by arrows. The key components are:
* **Initial Presentations:** Breathlessness, Arrhythmias, Third Heart Sound, Any Severe Presentations
* **Intermediate Diagnoses:** Suspected ACS, Strongly Suspected ACS, non-ST Elevation
* **Final Diagnoses:** STEMI-ACS, NSTEMI-ACS, NSTE-ACS, UA (Unstable Angina)
* **Tests/Criteria:** ST Elevation, hs-cTn (high-sensitivity Troponin), Cardiac Troponin, No Obvious ECG
### Detailed Analysis or Content Details
The diagram can be broken down into sections:
**Left Side - Initial Assessment:**
* "Breathlessness is a symptom..." leads to "Suspected ACS".
* "Arrhythmias is..." leads to "Suspected ACS".
* "Third Heart Sound..." leads to "Suspected ACS".
* "Any Severe Presentations..." leads to "Strongly Suspected ACS".
**Central Pathway:**
* "Suspected ACS" leads to both "Strongly Suspected ACS" and "NSTE-ACS".
* "Strongly Suspected ACS" leads to "STEMI-ACS" (via a red arrow) and "NSTE-ACS" (via a red arrow).
* "non-ST Elevation..." leads to "NSTE-ACS".
**Right Side - Further Refinement:**
* "ST Elevation is criteria..." leads to "STEMI-ACS".
* "hs-cTn Exceeded..." leads to "NSTEMI-ACS".
* "Cardiac Troponin" leads to "NSTEMI-ACS".
* "NSTE-ACS" leads to "UA" (via a red arrow) and "NSTEMI-ACS" (via a blue arrow).
* "No Obvious ECG..." leads to "UA".
The arrows are color-coded: blue arrows indicate a more direct or positive association, while red arrows suggest a less direct or alternative pathway. The "..." notation suggests that the phrases are incomplete.
### Key Observations
* The diagram highlights the importance of ST elevation and troponin levels in differentiating between types of ACS.
* The pathway is not strictly linear; there are multiple routes to different diagnoses.
* The use of color-coded arrows suggests varying degrees of certainty or likelihood in the diagnostic process.
* The diagram focuses on a clinical decision-making process, rather than presenting quantitative data.
### Interpretation
This diagram represents a simplified clinical algorithm for the diagnosis of Acute Coronary Syndrome. It illustrates how clinicians progress through a series of assessments – initial symptoms, ECG findings, and biomarker levels – to arrive at a specific diagnosis. The branching pathways reflect the complexity of ACS and the need for careful evaluation to determine the appropriate treatment strategy.
The distinction between STEMI-ACS (ST-Elevation Myocardial Infarction) and NSTEMI-ACS (Non-ST-Elevation Myocardial Infarction) is crucial, as STEMI typically requires immediate reperfusion therapy. The diagram emphasizes that the presence of ST elevation is a key criterion for STEMI diagnosis.
The inclusion of "Unstable Angina" (UA) as a possible diagnosis indicates that not all patients with suspected ACS will have evidence of myocardial damage (elevated troponin levels).
The "..." notation suggests that the diagram is a simplified representation of a more complex clinical reality. In practice, clinicians consider a wide range of factors when diagnosing and managing ACS. The diagram serves as a useful tool for understanding the basic principles of ACS diagnosis, but it should not be used as a substitute for clinical judgment.