## Line Chart: Similarity vs. Reasoning Step
### Overview
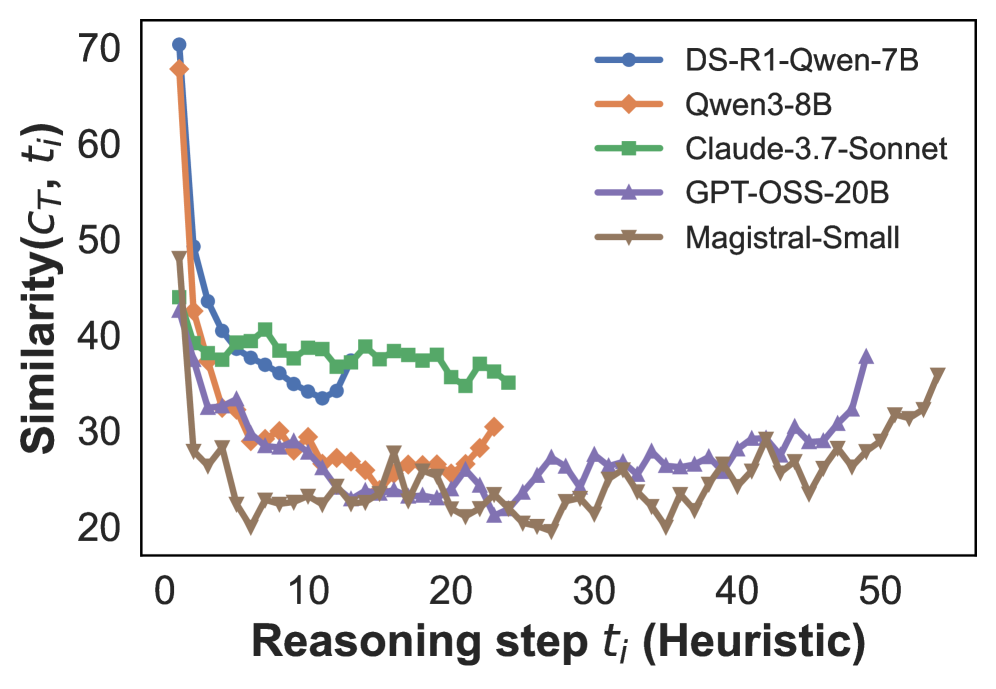
The image is a line chart comparing the similarity scores of five different language models across a series of reasoning steps. The x-axis represents the reasoning step (heuristic), and the y-axis represents the similarity score. The chart displays how the similarity changes as the models progress through the reasoning process.
### Components/Axes
* **X-axis:** Reasoning step tᵢ (Heuristic). Scale ranges from 0 to 50 in increments of 10.
* **Y-axis:** Similarity(C\_T, tᵢ). Scale ranges from 20 to 70 in increments of 10.
* **Legend:** Located in the top-right corner of the chart.
* Blue line with circle markers: DS-R1-Qwen-7B
* Orange line with diamond markers: Qwen3-8B
* Green line with square markers: Claude-3.7-Sonnet
* Purple line with triangle pointing up markers: GPT-OSS-20B
* Brown line with triangle pointing down markers: Magistral-Small
### Detailed Analysis
* **DS-R1-Qwen-7B (Blue):** Starts at approximately 70 and rapidly decreases to around 40 by step 5. It then fluctuates between 33 and 40 until step 20, after which it remains relatively stable.
* Step 0: ~70
* Step 5: ~40
* Step 10: ~35
* Step 20: ~38
* **Qwen3-8B (Orange):** Starts at approximately 68 and decreases to around 28 by step 10. It then fluctuates between 25 and 30 until step 25, after which it increases to around 35 by step 50.
* Step 0: ~68
* Step 10: ~28
* Step 20: ~28
* Step 50: ~35
* **Claude-3.7-Sonnet (Green):** Starts at approximately 48 and decreases to around 38 by step 5. It then fluctuates between 35 and 40 until step 25, after which it remains relatively stable.
* Step 0: ~48
* Step 5: ~38
* Step 10: ~39
* Step 20: ~38
* **GPT-OSS-20B (Purple):** Starts at approximately 44 and decreases to around 25 by step 5. It then fluctuates between 23 and 28 until step 30, after which it increases to around 38 by step 50.
* Step 0: ~44
* Step 5: ~25
* Step 10: ~30
* Step 30: ~25
* Step 50: ~38
* **Magistral-Small (Brown):** Starts at approximately 49 and decreases to around 22 by step 5. It then fluctuates between 20 and 25 until step 30, after which it increases to around 35 by step 50.
* Step 0: ~49
* Step 5: ~22
* Step 10: ~23
* Step 30: ~23
* Step 50: ~35
### Key Observations
* The models DS-R1-Qwen-7B, Qwen3-8B, and Claude-3.7-Sonnet show a rapid decrease in similarity in the initial reasoning steps, followed by a stabilization.
* The models GPT-OSS-20B and Magistral-Small show a decrease in similarity in the initial reasoning steps, followed by an increase in similarity in the later reasoning steps.
* DS-R1-Qwen-7B has the highest initial similarity, while Magistral-Small has the lowest.
* GPT-OSS-20B and Magistral-Small show a similar trend of decreasing and then increasing similarity.
### Interpretation
The chart illustrates how the similarity of different language models changes as they progress through a series of reasoning steps. The initial drop in similarity for most models suggests that the models initially struggle to maintain consistency in their reasoning. The subsequent stabilization or increase in similarity indicates that the models either adapt to the reasoning task or that the nature of the task changes, allowing for more consistent results. The differences in performance between the models may be attributed to their architecture, training data, or size. The GPT-OSS-20B and Magistral-Small models' trend of increasing similarity in later steps could indicate a learning or adaptation process that is not as pronounced in the other models.