## Diagram: Generative Model and Image Classifier Workflow
### Overview
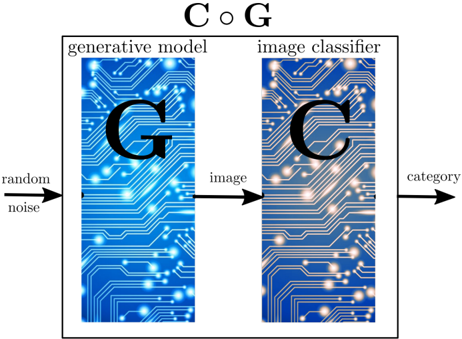
The diagram illustrates a two-stage computational pipeline involving a generative model and an image classifier. It depicts the flow of data from random noise through a generative process to produce an image, which is then classified into a category.
### Components/Axes
- **Title**: "C ○ G" (centered at the top).
- **Left Section**:
- Label: "generative model" (above a blue patterned rectangle).
- Text: "G" (large black letter centered in the rectangle).
- Input: "random noise" (arrow pointing to the left edge of the generative model).
- Output: "image" (arrow pointing from the right edge of the generative model to the image classifier).
- **Right Section**:
- Label: "image classifier" (above a blue patterned rectangle).
- Text: "C" (large black letter centered in the rectangle).
- Output: "category" (arrow pointing from the right edge of the image classifier).
### Detailed Analysis
- **Generative Model**:
- Represents a system (denoted by "G") that transforms random noise into structured images.
- Visualized with a blue background and white circuit-like patterns, symbolizing neural network architecture.
- **Image Classifier**:
- Represents a system (denoted by "C") that analyzes images and assigns them to predefined categories.
- Shares the same visual style as the generative model, emphasizing parallel computational processes.
- **Data Flow**:
1. **Random Noise** → **Generative Model (G)** → **Image** → **Image Classifier (C)** → **Category**.
2. Arrows indicate unidirectional flow, with no feedback loops shown.
### Key Observations
- The diagram uses consistent visual motifs (blue background, white circuit patterns) for both components, suggesting they are part of the same system.
- The labels "G" and "C" directly correspond to the generative model and classifier, respectively, aligning with common GAN (Generative Adversarial Network) terminology.
- No numerical values, scales, or legends are present, indicating this is a conceptual rather than quantitative representation.
### Interpretation
This diagram abstractly represents a **Generative Adversarial Network (GAN)** framework:
- The **generative model (G)** acts as the "generator," creating synthetic images from random noise.
- The **image classifier (C)** acts as the "discriminator," evaluating the authenticity of generated images and assigning categories.
- The absence of feedback loops (e.g., adversarial training dynamics) suggests this is a simplified depiction, focusing on the basic workflow rather than iterative optimization processes.
- The use of "C ○ G" as the title may symbolize the composition of the two systems in sequence, though the mathematical notation (circle-plus) is unconventional for GANs, which typically emphasize adversarial interaction (G vs. C).
No numerical data or trends are present. The diagram serves as a high-level schematic for understanding the roles of generative and classification components in image synthesis pipelines.