\n
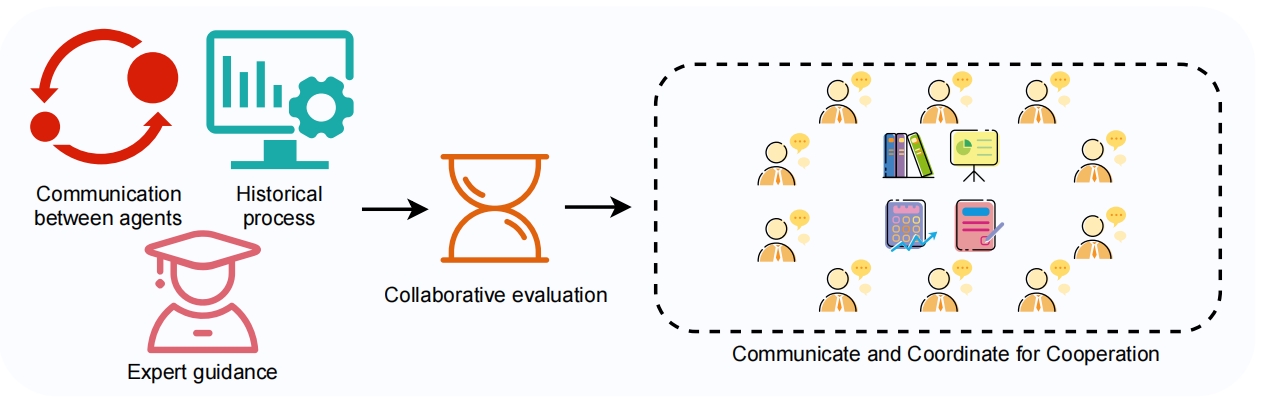
## Process Diagram: Collaborative Agent Coordination Framework
### Overview
The image is a conceptual process diagram illustrating a workflow for multi-agent collaboration. It depicts how three distinct input elements feed into a central evaluation phase, which then enables a coordinated group activity. The diagram uses stylized icons and directional arrows to show the flow of information or influence.
### Components/Axes
The diagram is organized into three main spatial regions:
1. **Input Region (Left Side):** Contains three distinct input components.
* **Top-Left:** A red circular icon with two arrows forming a cycle around two red circles. Label: **"Communication between agents"**.
* **Top-Center:** A teal icon of a computer monitor displaying a bar chart and a gear. Label: **"Historical process"**.
* **Bottom-Left:** A pink icon of a person wearing a graduation cap. Label: **"Expert guidance"**.
2. **Processing Region (Center):**
* An orange hourglass icon. Label: **"Collaborative evaluation"**.
* Two black arrows point from the three input components towards this hourglass, and one arrow points from the hourglass towards the right-side region.
3. **Output/Action Region (Right Side):**
* A large, dashed-line rectangular box containing a network of icons.
* **Central Cluster:** Within the box, there is a central cluster of four resource icons: a bookshelf, a presentation chart, a calculator with an upward trend, and a document with a pen.
* **Agent Network:** Surrounding the central cluster are ten identical icons of people with speech bubbles, arranged in a circular formation. This entire group is labeled: **"Communicate and Coordinate for Cooperation"**.
### Detailed Analysis
* **Flow Direction:** The process flows unidirectionally from left to right. The three inputs (agent communication, historical data, expert guidance) are processed through "Collaborative evaluation," which results in the final state of agents communicating and coordinating around shared resources.
* **Component Relationships:** The diagram suggests that effective coordination (right) is not a starting point but an outcome. It is enabled by a structured evaluation process that synthesizes ongoing agent interactions, past process data, and external expert input.
* **Visual Metaphors:**
* The **hourglass** for "Collaborative evaluation" implies a process that requires time and involves filtering or refining inputs.
* The **dashed box** around the final group signifies a defined collaborative space or system boundary.
* The **circular arrangement** of agents around central resources suggests equality, continuous interaction, and a shared focus.
### Key Observations
1. **No Quantitative Data:** The diagram is purely conceptual and contains no numerical data, charts, or graphs. It illustrates a model or framework, not measured outcomes.
2. **Symmetry and Equality:** The ten agent icons in the final stage are visually identical and symmetrically placed, implying a non-hierarchical structure where all agents have equal standing in the coordination process.
3. **Resource-Centric Coordination:** The coordination is explicitly centered around shared informational resources (books, charts, data, documents), not just interpersonal communication.
4. **Multi-Source Foundation:** The model explicitly values three distinct pillars for enabling cooperation: dynamic interaction (communication), empirical data (history), and authoritative knowledge (experts).
### Interpretation
This diagram presents a **Peircean investigative model** for understanding how robust multi-agent systems can be designed. It argues that successful cooperation is not spontaneous but is the product of a deliberate, structured process.
* **The "Why":** The framework suggests that for agents (which could be AI models, human teams, or organizational units) to cooperate effectively, they must move beyond simple interaction. They require a dedicated phase of **evaluation** that synthesizes their own communications, learns from historical patterns, and incorporates higher-level expert guidance.
* **Reading Between the Lines:** The placement of "Expert guidance" as a foundational input is significant. It implies that purely data-driven or emergent systems may be insufficient; they benefit from injected, structured knowledge. The final state—agents coordinating around shared resources—highlights that the goal of cooperation is often **collective problem-solving or knowledge work**, not just task completion.
* **Anomaly/Notable Design Choice:** The "Historical process" is represented by a computer with a chart and gear, blending data (chart) with mechanism (gear). This implies that history is not just a passive record but an active, mechanistic part of the system that informs current evaluation.
In essence, the diagram is a blueprint for building cooperative intelligence, emphasizing that evaluation is the critical transformative step that turns raw inputs into coordinated action.