## Scatter Plot: LongBench Accuracy vs KV Cache Size (Dataset: Samsum)
### Overview
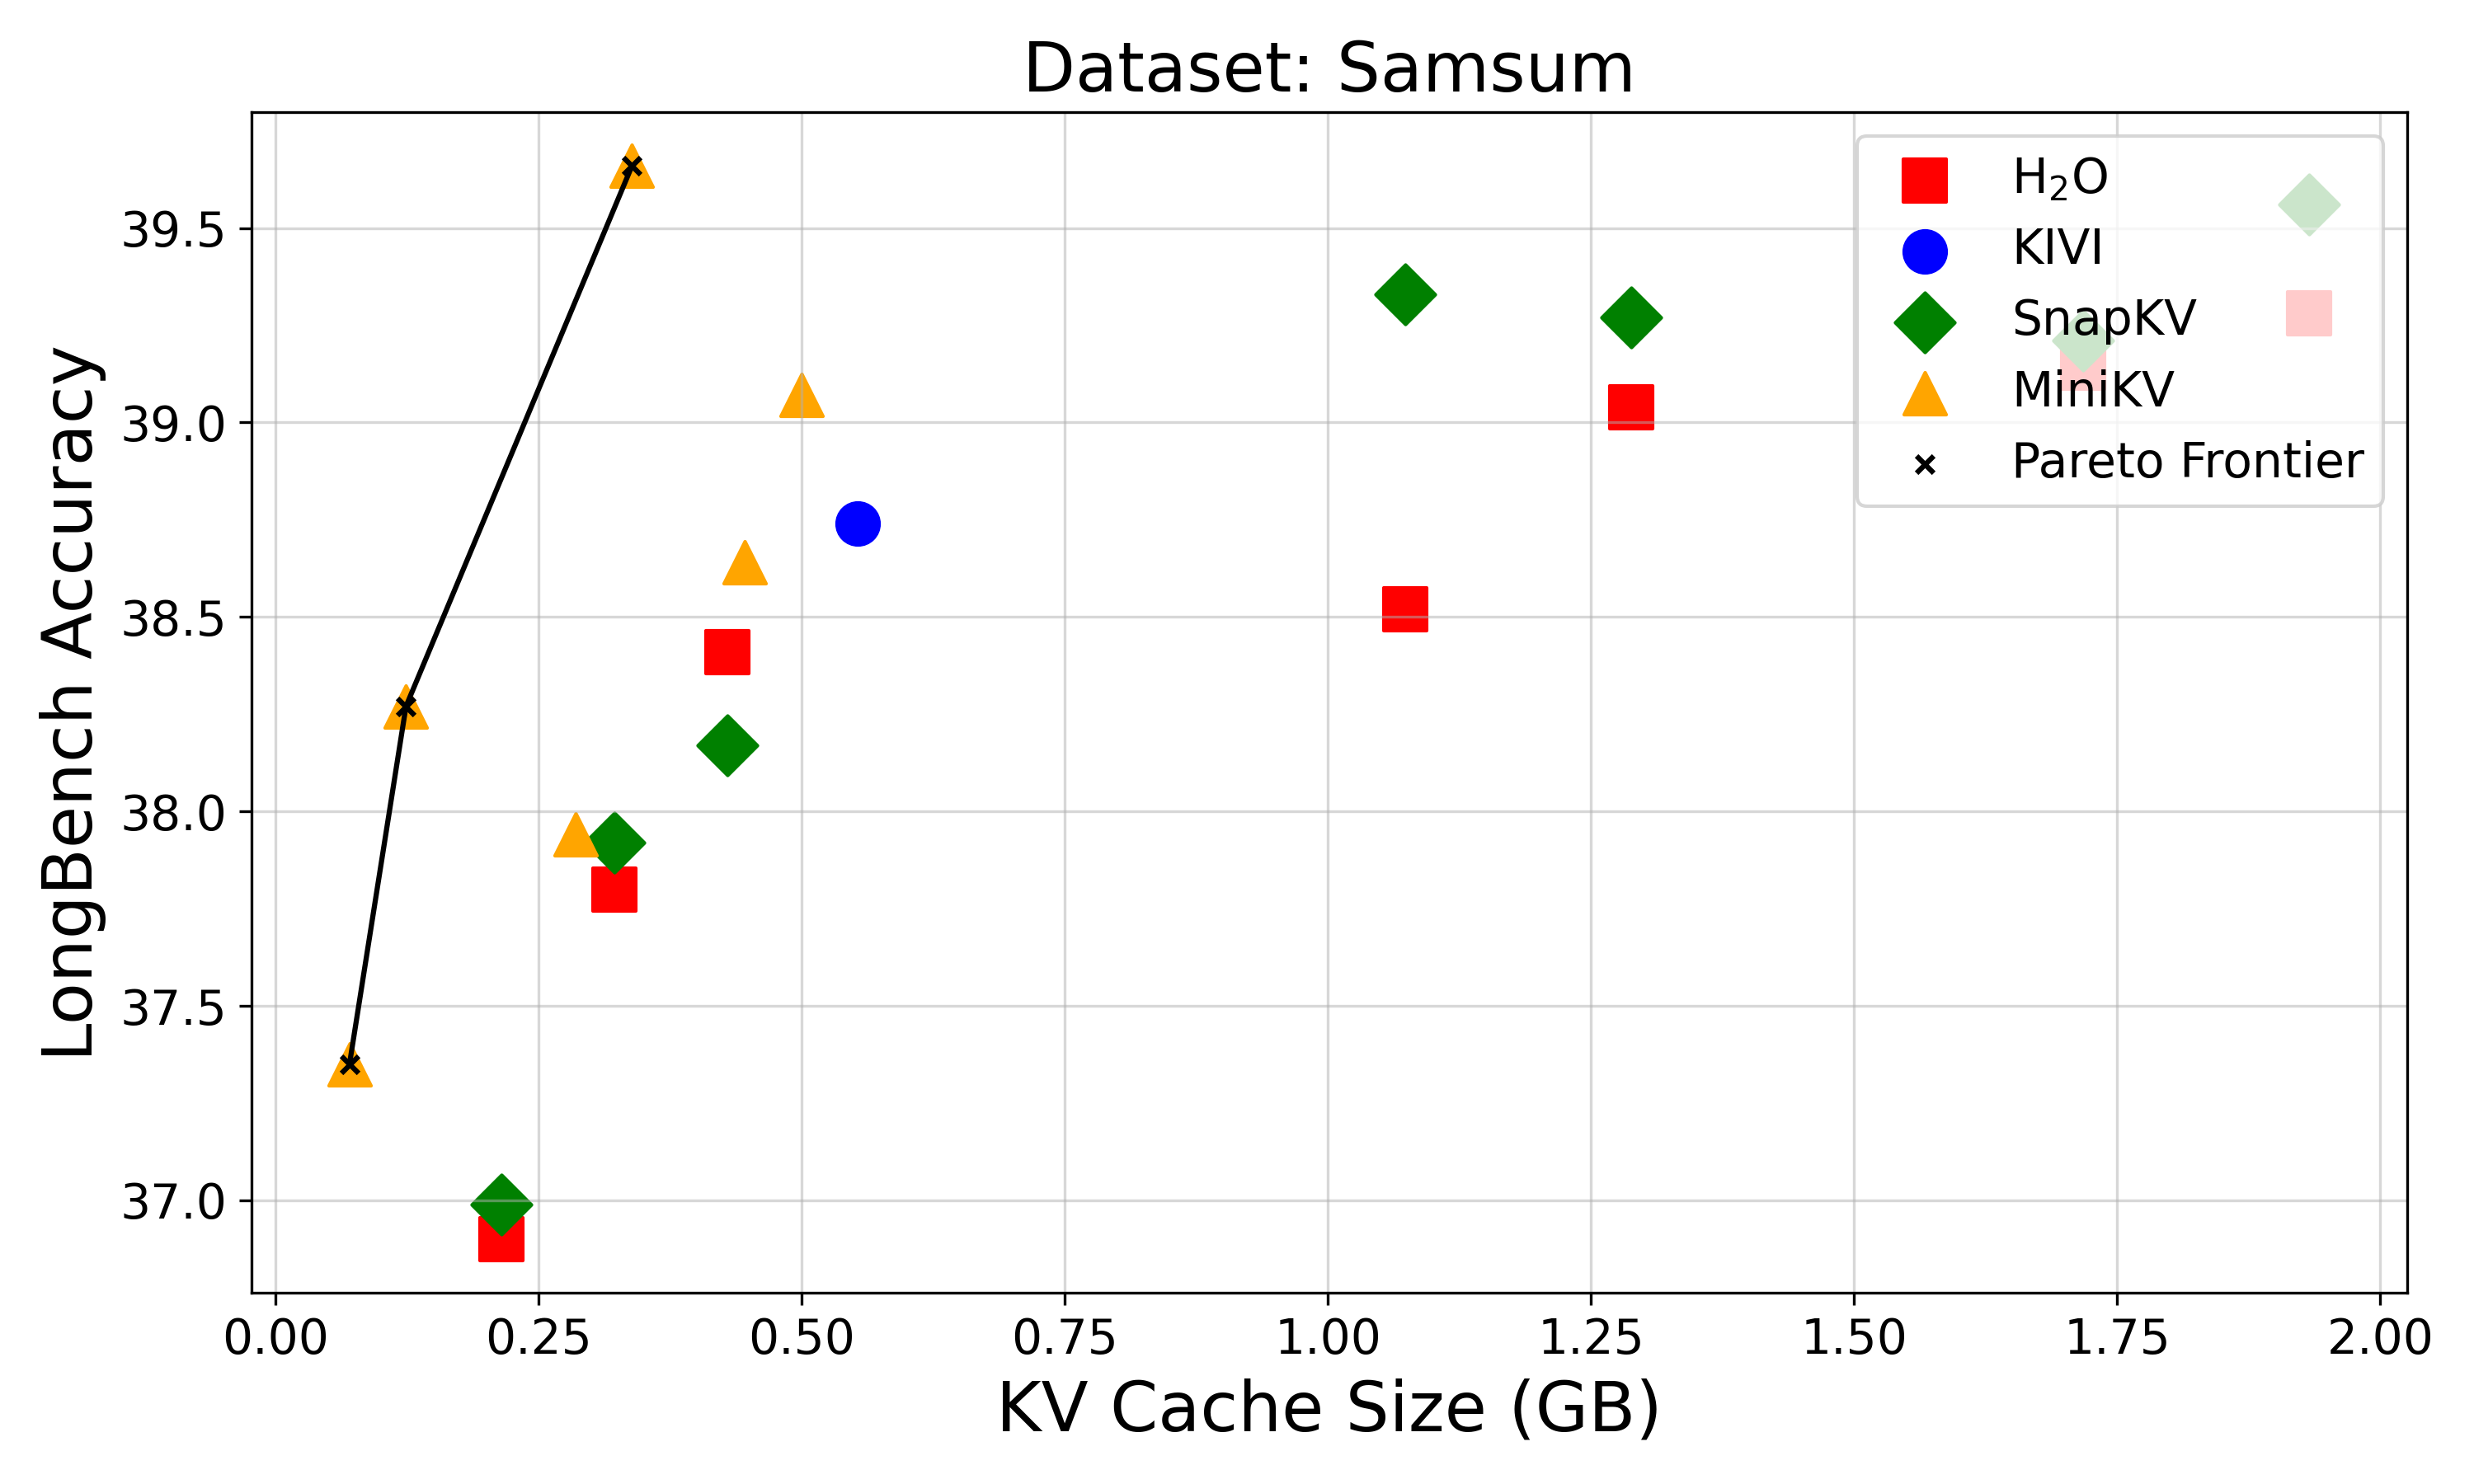
The image is a scatter plot visualizing the relationship between KV Cache Size (in GB) and LongBench Accuracy for different models on the Samsum dataset. The plot includes a Pareto Frontier line to highlight optimal trade-offs between cache size and accuracy.
### Components/Axes
- **X-axis**: KV Cache Size (GB), ranging from 0.00 to 2.00 GB in increments of 0.25 GB.
- **Y-axis**: LongBench Accuracy, ranging from 37.0 to 39.5 in increments of 0.5.
- **Legend**: Located in the top-right corner, with the following mappings:
- **Red squares**: H2O
- **Blue circle**: KIVI
- **Green diamonds**: SnapKV
- **Yellow triangles**: MiniKV
- **Black 'x' markers**: Pareto Frontier
### Detailed Analysis
#### Data Series Trends
1. **Pareto Frontier (Black 'x' line)**:
- Starts at (0.1 GB, 37.3) and increases steadily to (0.5 GB, 38.5), then plateaus slightly.
- Represents the optimal trade-off between cache size and accuracy.
2. **H2O (Red squares)**:
- Points at (0.25 GB, 37.0), (0.5 GB, 38.4), (1.0 GB, 38.5), and (1.25 GB, 39.0).
- Shows a gradual increase in accuracy with larger cache sizes.
3. **KIVI (Blue circle)**:
- Single point at (0.5 GB, 38.7).
- Lies below the Pareto Frontier, indicating suboptimal performance.
4. **SnapKV (Green diamonds)**:
- Points at (0.25 GB, 37.0), (0.5 GB, 38.2), (1.0 GB, 39.3), and (1.25 GB, 39.2).
- Demonstrates a strong upward trend, approaching the Pareto Frontier at larger cache sizes.
5. **MiniKV (Yellow triangles)**:
- Points at (0.1 GB, 37.3), (0.25 GB, 37.9), (0.5 GB, 38.6), and (0.75 GB, 39.6).
- Highest accuracy (39.6) at 0.75 GB, surpassing the Pareto Frontier.