# Technical Document Analysis of Heatmap
## 1. Labels and Axis Titles
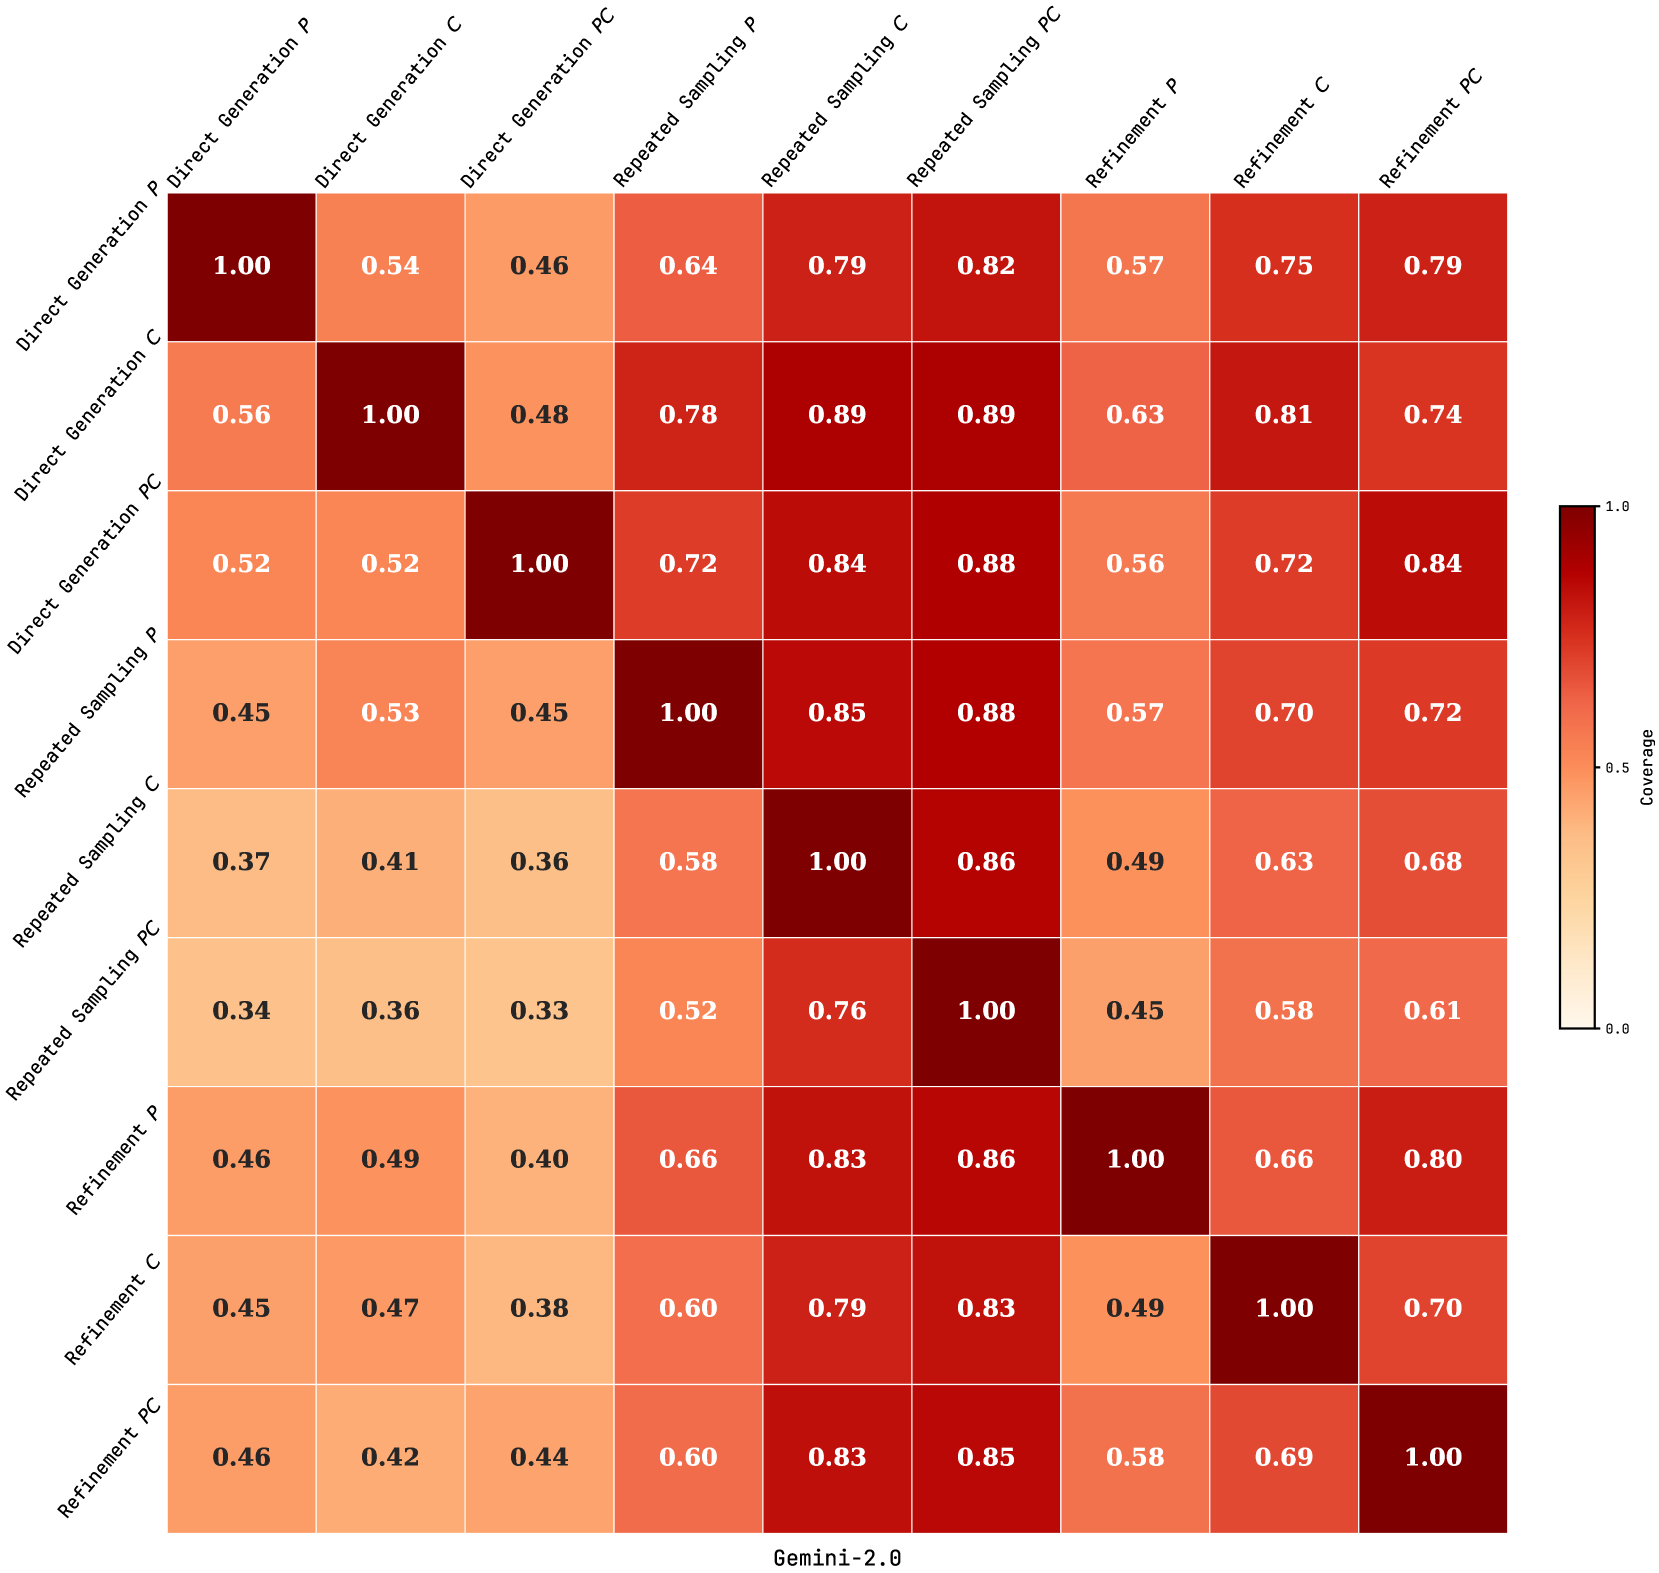
- **Rows (Methods)**:
- Direct Generation P
- Direct Generation C
- Direct Generation PC
- Repeated Sampling P
- Repeated Sampling C
- Repeated Sampling PC
- Refinement P
- Refinement C
- Refinement PC
- **Columns (Gemini-2.0 Methods)**:
- Direct Generation P
- Direct Generation C
- Direct Generation PC
- Repeated Sampling P
- Repeated Sampling C
- Repeated Sampling PC
- Refinement P
- Refinement C
- Refinement PC
- **Legend**:
- **Color Scale**: Ranges from **0.0 (light yellow)** to **1.0 (dark red)**.
- **Label**: "Coverage" (explicitly stated in the legend).
---
## 2. Key Trends and Data Points
- **Diagonal Values**: All diagonal cells (e.g., Direct Generation P vs. Direct Generation P) have a value of **1.00**, indicating perfect coverage when comparing a method to itself.
- **Coverage Degradation**:
- Coverage decreases as the distance from the diagonal increases. For example:
- Direct Generation P vs. Repeated Sampling P: **0.64**
- Direct Generation P vs. Refinement P: **0.57**
- The lowest coverage values are in the bottom-left quadrant (e.g., Repeated Sampling PC vs. Refinement PC: **0.33**).
- **Highest Non-Diagonal Coverage**:
- Repeated Sampling C vs. Repeated Sampling PC: **0.89**
- Repeated Sampling P vs. Repeated Sampling C: **0.85**
---
## 3. Data Table Reconstruction
| Method (Row) | Direct Generation P | Direct Generation C | Direct Generation PC | Repeated Sampling P | Repeated Sampling C | Repeated Sampling PC | Refinement P | Refinement C | Refinement PC |
|-----------------------|---------------------|---------------------|----------------------|---------------------|---------------------|----------------------|--------------|--------------|---------------|
| **Direct Generation P** | 1.00 | 0.54 | 0.46 | 0.64 | 0.79 | 0.82 | 0.57 | 0.75 | 0.79 |
| **Direct Generation C** | 0.56 | 1.00 | 0.48 | 0.78 | 0.89 | 0.89 | 0.63 | 0.81 | 0.74 |
| **Direct Generation PC**| 0.52 | 0.52 | 1.00 | 0.72 | 0.84 | 0.88 | 0.56 | 0.72 | 0.84 |
| **Repeated Sampling P** | 0.45 | 0.53 | 0.45 | 1.00 | 0.85 | 0.88 | 0.57 | 0.70 | 0.72 |
| **Repeated Sampling C** | 0.37 | 0.41 | 0.36 | 0.58 | 1.00 | 0.86 | 0.49 | 0.63 | 0.68 |
| **Repeated Sampling PC**| 0.34 | 0.36 | 0.33 | 0.52 | 0.76 | 1.00 | 0.45 | 0.58 | 0.61 |
| **Refinement P** | 0.46 | 0.49 | 0.40 | 0.66 | 0.83 | 0.86 | 1.00 | 0.66 | 0.80 |
| **Refinement C** | 0.45 | 0.47 | 0.38 | 0.60 | 0.79 | 0.83 | 0.49 | 1.00 | 0.70 |
| **Refinement PC** | 0.46 | 0.42 | 0.44 | 0.60 | 0.83 | 0.85 | 0.58 | 0.69 | 1.00 |
---
## 4. Legend and Color Matching
- **Legend Position**: Right side of the heatmap.
- **Color Matching**:
- **Dark Red** (1.00) matches the diagonal.
- **Light Yellow** (0.33–0.45) matches the lowest values in the bottom-left quadrant.
- Intermediate values (e.g., 0.5–0.8) use gradient shades of orange/red.
---
## 5. Spatial Grounding
- **Legend Placement**: Right of the heatmap.
- **Axis Labels**:
- Rows: Left side.
- Columns: Top of the heatmap.
---
## 6. Trend Verification
- **Row Trends**:
- **Direct Generation P**: Starts at 1.00 (diagonal), decreases to 0.54 (Direct Generation C), then 0.46 (Direct Generation PC), and further declines to 0.57 (Refinement P).
- **Refinement PC**: Starts at 1.00 (diagonal), decreases to 0.46 (Direct Generation P), then 0.42 (Direct Generation C), and stabilizes at 0.69 (Refinement C).
- **Column Trends**:
- **Refinement P**: Starts at 1.00 (diagonal), decreases to 0.46 (Direct Generation P), then 0.49 (Direct Generation C), and stabilizes at 0.66 (Refinement C).
---
## 7. Component Isolation
- **Header**: Row labels (methods).
- **Main Chart**: 9x9 heatmap with coverage values.
- **Footer**: Legend (color scale).
---
## 8. Additional Notes
- **Language**: All text is in English.
- **Data Completeness**: All 81 cells are filled with numerical values.
- **No Missing Data**: No empty cells or annotations.
---
## 9. Final Observations
- The heatmap quantifies **coverage similarity** between different methods (e.g., Direct Generation vs. Refinement).
- **High Coverage** (near 1.00) indicates strong alignment between methods.
- **Low Coverage** (near 0.3–0.5) suggests significant divergence in performance or output.