\n
## Line Chart: Normalized Speedup vs. Mix
### Overview
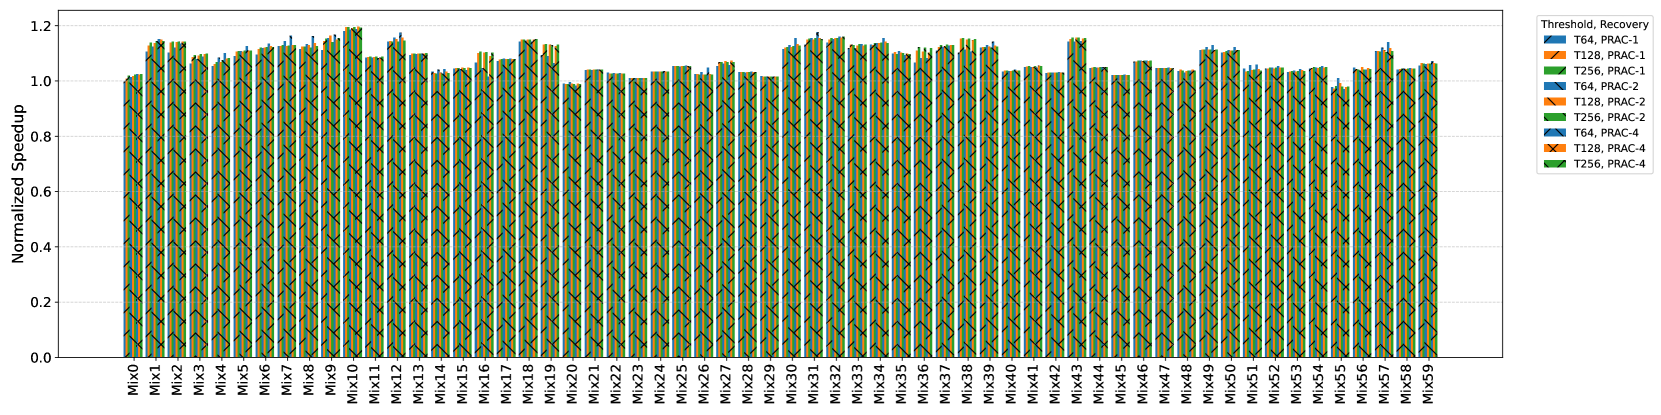
The image presents a line chart illustrating the normalized speedup achieved across a series of mixes (Mix 0 to Mix 59). The chart compares the performance of different threshold/recovery configurations: T64, T128, and T256, each with PRAC-2, PRAC-3, and PRAC-4 settings. The y-axis represents the normalized speedup, ranging from 0.0 to 1.2, while the x-axis represents the mix number.
### Components/Axes
* **X-axis:** Mix (Mix 0 to Mix 59). The mixes are evenly spaced along the horizontal axis.
* **Y-axis:** Normalized Speedup (ranging from 0.0 to 1.2).
* **Legend:** Located in the top-right corner, the legend identifies the different lines by their threshold and recovery settings:
* T64, PRAC-3 (Blue)
* T128, PRAC-3 (Orange)
* T256, PRAC-3 (Green)
* T64, PRAC-2 (Light Blue)
* T128, PRAC-2 (Red)
* T256, PRAC-2 (Dark Green)
* T64, PRAC-4 (Gray)
* T128, PRAC-4 (Magenta)
* T256, PRAC-4 (Black)
### Detailed Analysis
The chart displays a repeating pattern of speedup fluctuations across the mixes. Each set of three lines (T64, T128, T256) for a given PRAC setting (2, 3, or 4) exhibits a similar oscillating behavior.
Here's a breakdown of the approximate speedup values for each configuration, noting the repeating pattern:
* **T64, PRAC-3 (Blue):** The line oscillates between approximately 0.05 and 1.15. The trend is generally flat, with consistent oscillations.
* **T128, PRAC-3 (Orange):** Similar to the blue line, it oscillates between approximately 0.05 and 1.15, with a flat trend.
* **T256, PRAC-3 (Green):** Oscillates between approximately 0.05 and 1.15, with a flat trend.
* **T64, PRAC-2 (Light Blue):** Oscillates between approximately 0.05 and 1.15, with a flat trend.
* **T128, PRAC-2 (Red):** Oscillates between approximately 0.05 and 1.15, with a flat trend.
* **T256, PRAC-2 (Dark Green):** Oscillates between approximately 0.05 and 1.15, with a flat trend.
* **T64, PRAC-4 (Gray):** Oscillates between approximately 0.05 and 1.15, with a flat trend.
* **T128, PRAC-4 (Magenta):** Oscillates between approximately 0.05 and 1.15, with a flat trend.
* **T256, PRAC-4 (Black):** Oscillates between approximately 0.05 and 1.15, with a flat trend.
The speedup values appear to peak around Mix 1, Mix 7, Mix 13, Mix 19, Mix 25, Mix 31, Mix 37, Mix 43, Mix 49, and Mix 55. The speedup values reach their minimum around Mix 0, Mix 6, Mix 12, Mix 18, Mix 24, Mix 30, Mix 36, Mix 42, Mix 48, and Mix 54.
### Key Observations
* All configurations exhibit a similar oscillating pattern, suggesting that the mix number significantly influences the speedup.
* There is minimal difference in speedup between the different threshold/recovery configurations. The lines are closely clustered together.
* The speedup generally remains between 0.05 and 1.15 across all mixes and configurations.
* The repeating pattern suggests a cyclical dependency between the mix and the speedup.
### Interpretation
The data suggests that the choice of threshold/recovery configuration (T64, T128, T256 with PRAC-2, PRAC-3, PRAC-4) has a limited impact on the normalized speedup. The primary driver of speedup variation appears to be the mix number itself, indicating a cyclical pattern in the workload or data distribution. The consistent oscillations across all configurations suggest that the underlying system is responding to a repeating characteristic of the mixes.
The fact that the speedup fluctuates between 0.05 and 1.15 indicates that the system's performance is significantly affected by the mix, but it doesn't fall to zero or reach exceptionally high values. This could imply that the system is relatively stable but susceptible to performance variations based on the input mix.
Further investigation is needed to understand the nature of the mixes and why they cause this cyclical speedup pattern. Analyzing the characteristics of the mixes (e.g., data size, complexity, access patterns) could reveal the underlying cause of the observed behavior.