## Line Chart: R1-Llama | AIME24
### Overview
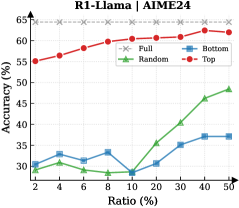
The image is a line chart comparing the accuracy of different models (Full, Random, Bottom, Top) at various ratios. The x-axis represents the ratio in percentage, and the y-axis represents the accuracy in percentage.
### Components/Axes
* **Title:** R1-Llama | AIME24
* **X-axis:** Ratio (%) - with markers at 2, 4, 6, 8, 10, 20, 30, 40, 50
* **Y-axis:** Accuracy (%) - with markers at 30, 35, 40, 45, 50, 55, 60, 65
* **Legend:** Located in the top-right corner of the chart.
* Full (Gray dashed line with x markers)
* Random (Green line with triangle markers)
* Bottom (Blue line with square markers)
* Top (Red line with circle markers)
### Detailed Analysis
* **Full (Gray dashed line with x markers):** The accuracy remains relatively constant at approximately 64% across all ratios.
* Ratio 2%: ~64%
* Ratio 50%: ~64%
* **Random (Green line with triangle markers):** The accuracy starts around 32%, decreases slightly, then increases significantly as the ratio increases.
* Ratio 2%: ~32%
* Ratio 8%: ~28%
* Ratio 50%: ~49%
* **Bottom (Blue line with square markers):** The accuracy fluctuates between 30% and 38% across all ratios.
* Ratio 2%: ~30%
* Ratio 10%: ~29%
* Ratio 40%: ~37%
* Ratio 50%: ~37%
* **Top (Red line with circle markers):** The accuracy starts at 55% and gradually increases to approximately 62% as the ratio increases.
* Ratio 2%: ~55%
* Ratio 10%: ~60%
* Ratio 50%: ~62%
### Key Observations
* The "Full" model consistently maintains the highest accuracy across all ratios.
* The "Top" model shows a gradual increase in accuracy as the ratio increases.
* The "Random" model exhibits the most significant improvement in accuracy as the ratio increases.
* The "Bottom" model has the lowest and most stable accuracy across all ratios.
### Interpretation
The chart compares the performance of different models (Full, Random, Bottom, Top) based on accuracy at varying ratios. The "Full" model, likely representing the complete dataset or a baseline model, consistently outperforms the other models. The "Top" model shows a steady improvement, suggesting that focusing on the top-ranked data points enhances accuracy. The "Random" model's significant increase in accuracy with higher ratios indicates that random sampling becomes more effective as the dataset expands. The "Bottom" model's low and stable accuracy suggests that focusing on the bottom-ranked data points does not contribute significantly to overall accuracy. The data suggests that strategic selection of data points (e.g., "Top") can improve model performance compared to random selection or focusing on less relevant data points ("Bottom").