## 3D Scatter Plot: Token Sequence Evolution in PCA Space
### Overview
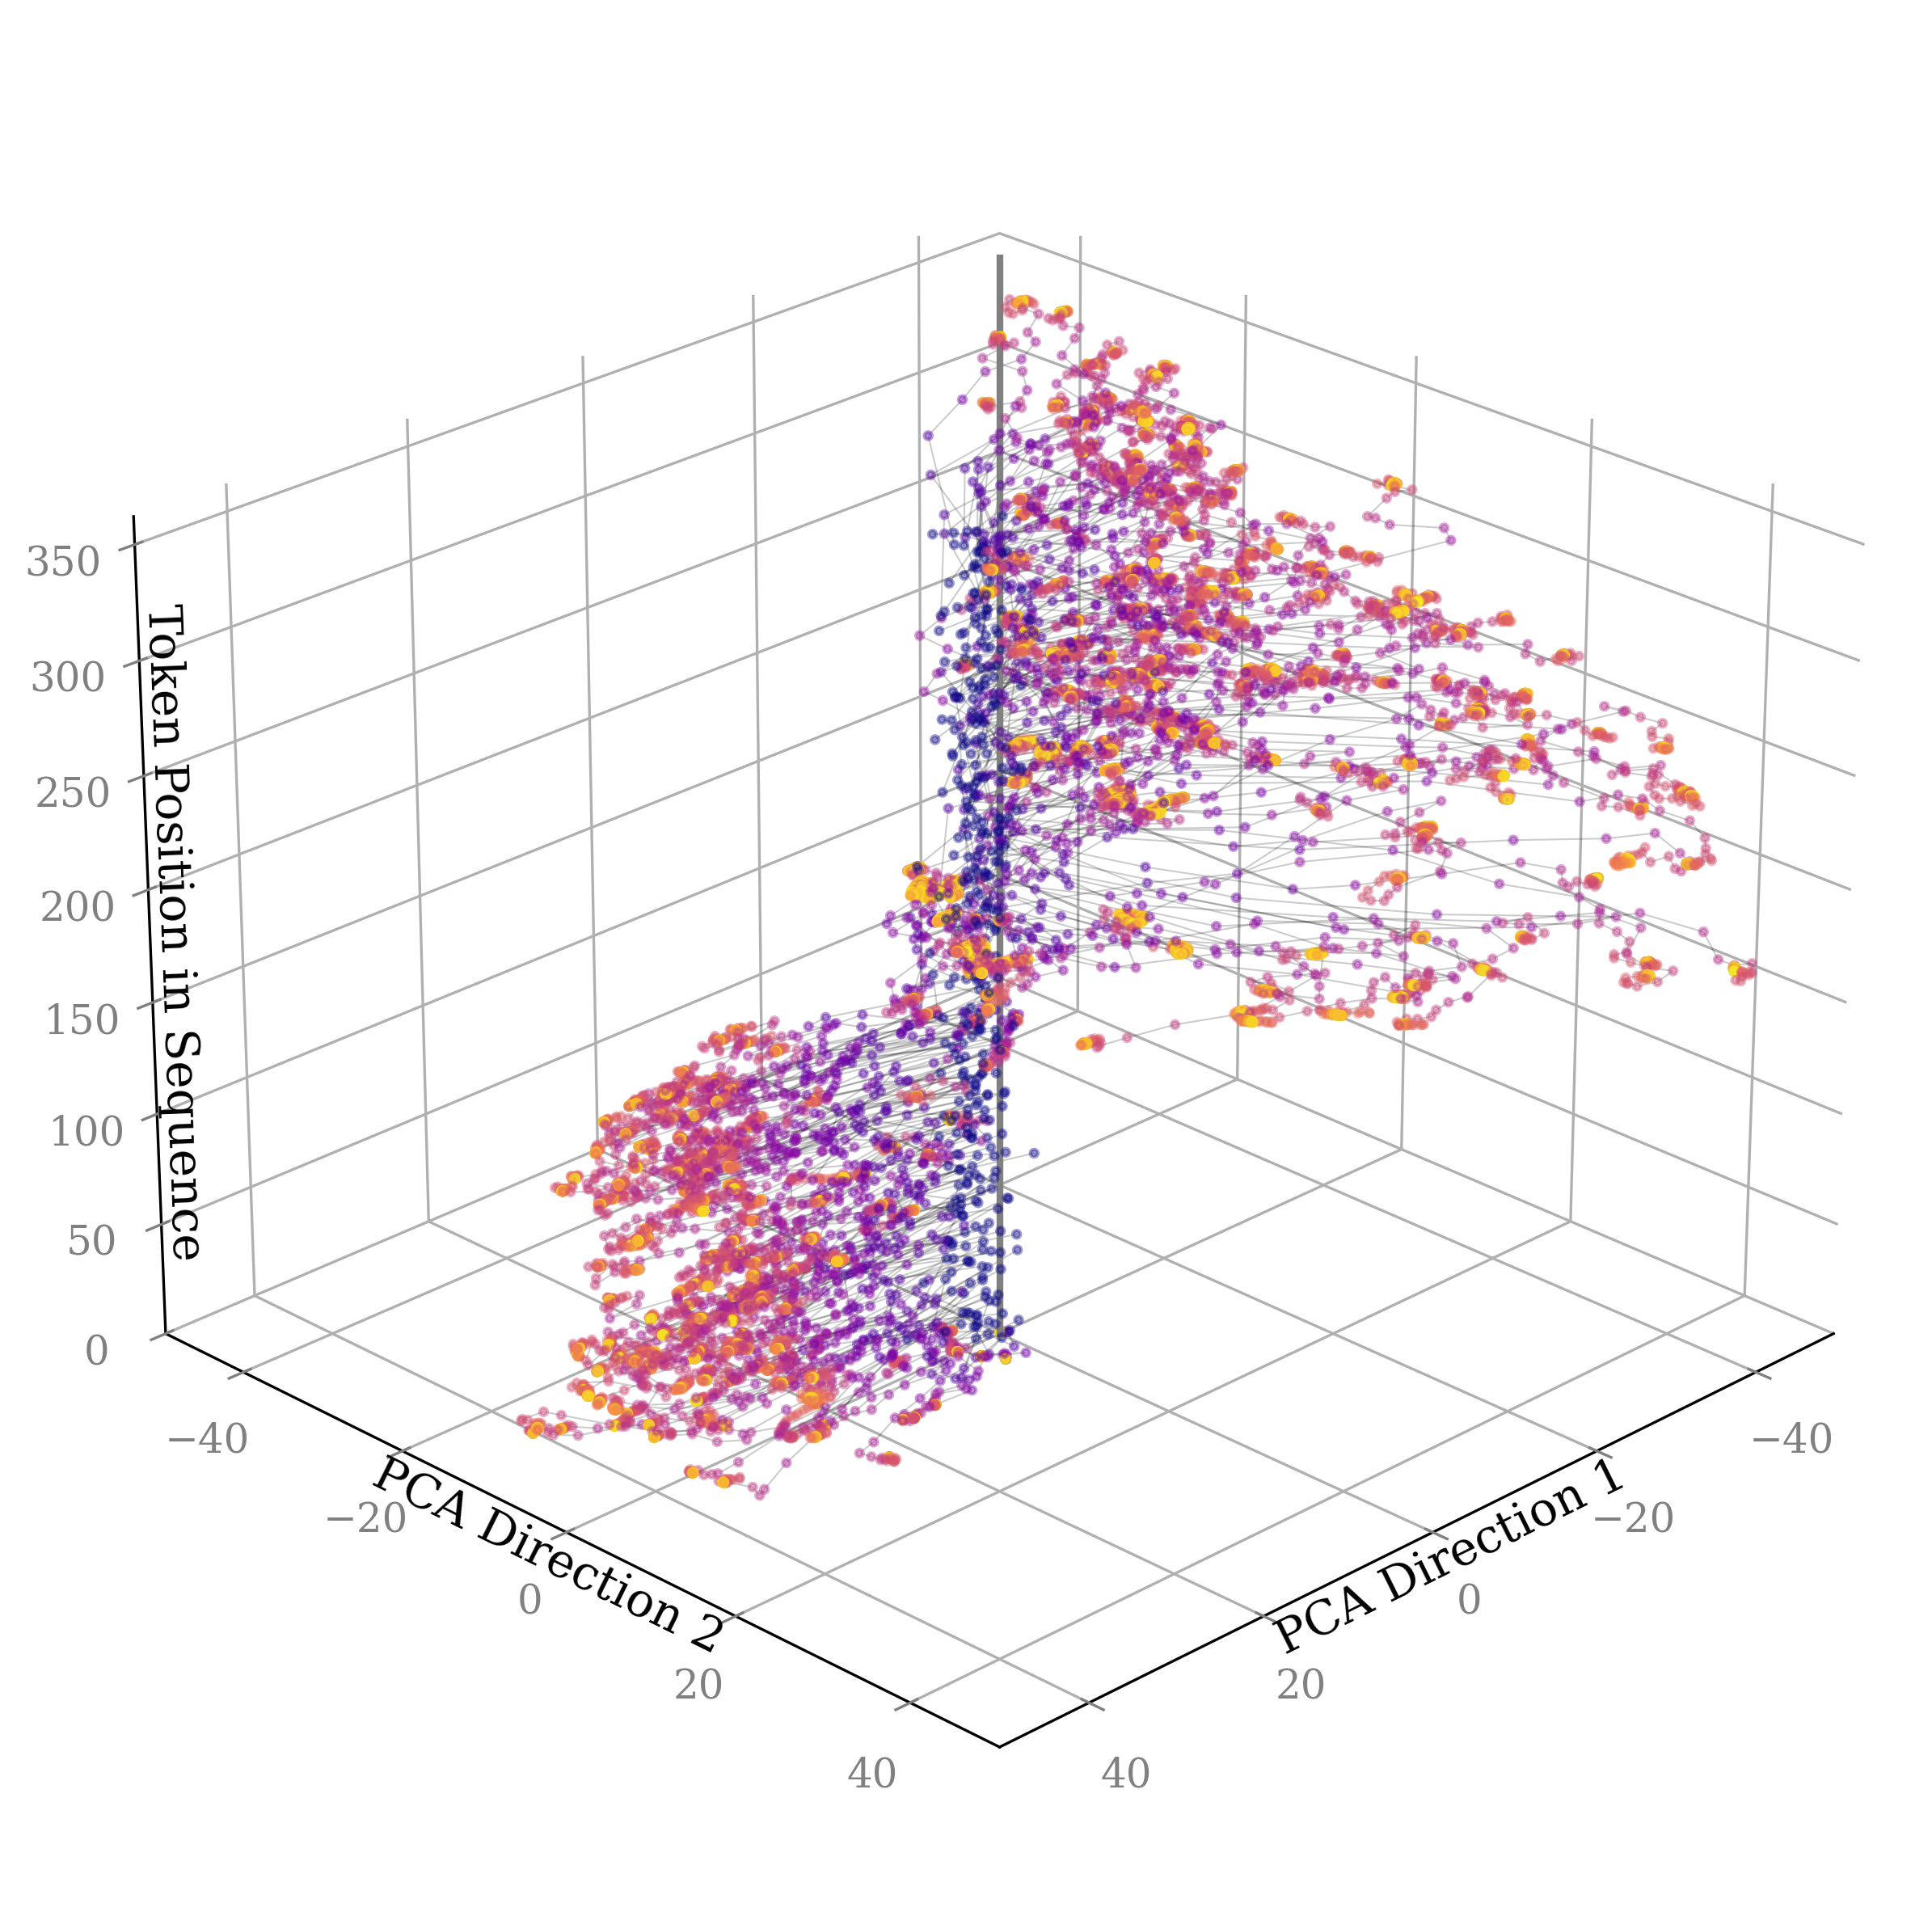
The image displays a three-dimensional scatter plot with points connected by thin lines, visualizing the trajectory or distribution of data points across three dimensions. The plot appears to represent the evolution or state of sequential data (likely tokens from a language model) as they progress through a sequence, projected into a reduced-dimensional space via Principal Component Analysis (PCA). The data points form a dense, complex cloud that expands and changes shape as the sequence progresses.
### Components/Axes
* **Chart Type:** 3D Scatter Plot with connecting lines (a 3D line/scatter hybrid).
* **Axes:**
* **X-Axis (Bottom Right):** Labeled "PCA Direction 1". The scale runs from approximately -40 to 40, with major tick marks at -40, -20, 0, 20, 40.
* **Y-Axis (Bottom Left):** Labeled "PCA Direction 2". The scale runs from approximately -40 to 40, with major tick marks at -40, -20, 0, 20, 40.
* **Z-Axis (Vertical, Left Side):** Labeled "Token Position in Sequence". The scale runs from 0 to 350, with major tick marks at 0, 50, 100, 150, 200, 250, 300, 350.
* **Data Series & Legend:** There is **no explicit legend** provided in the image. The data points are colored on a gradient. The color appears to be mapped to the "Token Position in Sequence" (Z-axis value):
* **Lower Z-values (Token Position ~0-100):** Points are predominantly **dark purple/indigo**.
* **Mid Z-values (Token Position ~100-250):** Points transition through **magenta and pink**.
* **Higher Z-values (Token Position ~250-350):** Points are predominantly **orange and yellow**.
* **Spatial Grounding:** The plot is viewed from an isometric perspective. The Z-axis is vertical on the left. The X and Y axes form the floor plane, with "PCA Direction 1" extending to the right and "PCA Direction 2" extending to the left. The data cloud occupies the central volume of the plotted space.
### Detailed Analysis
* **Data Distribution & Trend:**
1. **At Low Token Positions (Z ≈ 0-100):** The data points (purple) are tightly clustered in a relatively small region of the PCA space. They are concentrated roughly between -20 to 20 on both PCA Direction 1 and PCA Direction 2. The connecting lines show a dense, localized network.
2. **At Mid Token Positions (Z ≈ 100-250):** As the token position increases, the cloud of points (now magenta/pink) begins to expand significantly, primarily along the "PCA Direction 1" axis. The spread on "PCA Direction 2" also increases but to a lesser degree. The structure becomes more diffuse and elongated.
3. **At High Token Positions (Z ≈ 250-350):** The points (orange/yellow) show the greatest dispersion. They span a wide range on "PCA Direction 1" (from approx. -30 to +40) and a moderate range on "PCA Direction 2" (from approx. -20 to +30). The overall shape resembles a widening plume or fan that originates from the dense cluster at the bottom.
* **Visual Trend Verification:** The primary visual trend is a clear **expansion of the data manifold** as the "Token Position in Sequence" increases. The system's state, as captured by the first two PCA components, explores a progressively larger region of the feature space as the sequence length grows. The trajectory is not a single line but a broad, evolving distribution.
### Key Observations
1. **Non-Linear Expansion:** The increase in variance is not linear. The most dramatic expansion in the PCA space occurs after approximately token position 100-150.
2. **Anisotropic Spread:** The expansion is not uniform in all directions. The spread along "PCA Direction 1" is noticeably greater than along "PCA Direction 2", suggesting that the primary axis of variation in the underlying data is captured more by the first principal component.
3. **Density Gradient:** The point density is highest at the lowest token positions and decreases as position increases, correlating with the color shift from purple to yellow.
4. **Connectivity:** The thin lines connecting points suggest a sequential or temporal relationship between states, tracing paths through the PCA space as the sequence unfolds.
### Interpretation
This visualization likely depicts the **internal state evolution of a sequential model** (e.g., a Transformer's token embeddings or hidden states) as it processes a long sequence. The PCA projection reduces the high-dimensional state vectors into 3 interpretable dimensions.
* **What it Suggests:** The data demonstrates that the model's representation of information becomes more diverse and complex as the sequence progresses. Early tokens (low position) exist in a constrained, similar state space. As more context is accumulated (higher position), the model's internal representations diverge significantly, occupying a much broader semantic or syntactic space. This could reflect the model building up complex, context-dependent meanings.
* **Relationship Between Elements:** The Z-axis (Token Position) acts as the independent variable driving change. The X and Y axes (PCA Directions) are dependent variables showing the effect. The color gradient reinforces the Z-axis trend, providing a visual cue for progression.
* **Notable Patterns/Anomalies:** The anisotropic spread (wider on PCA Direction 1) is a key pattern. It indicates that the most significant mode of variation in the model's state is aligned with that specific principal component. There are no obvious outlier clusters disconnected from the main plume; the evolution appears continuous. The lack of a legend is a minor limitation, but the strong correlation between color and Z-position allows for confident inference.
**In summary, the chart provides strong visual evidence that the represented system's state space expands and diversifies in a structured, non-random manner as a function of sequence length, with the primary axis of variation becoming more pronounced over time.**