## Line Chart: NNCD Improvement vs. Number of Shots
### Overview
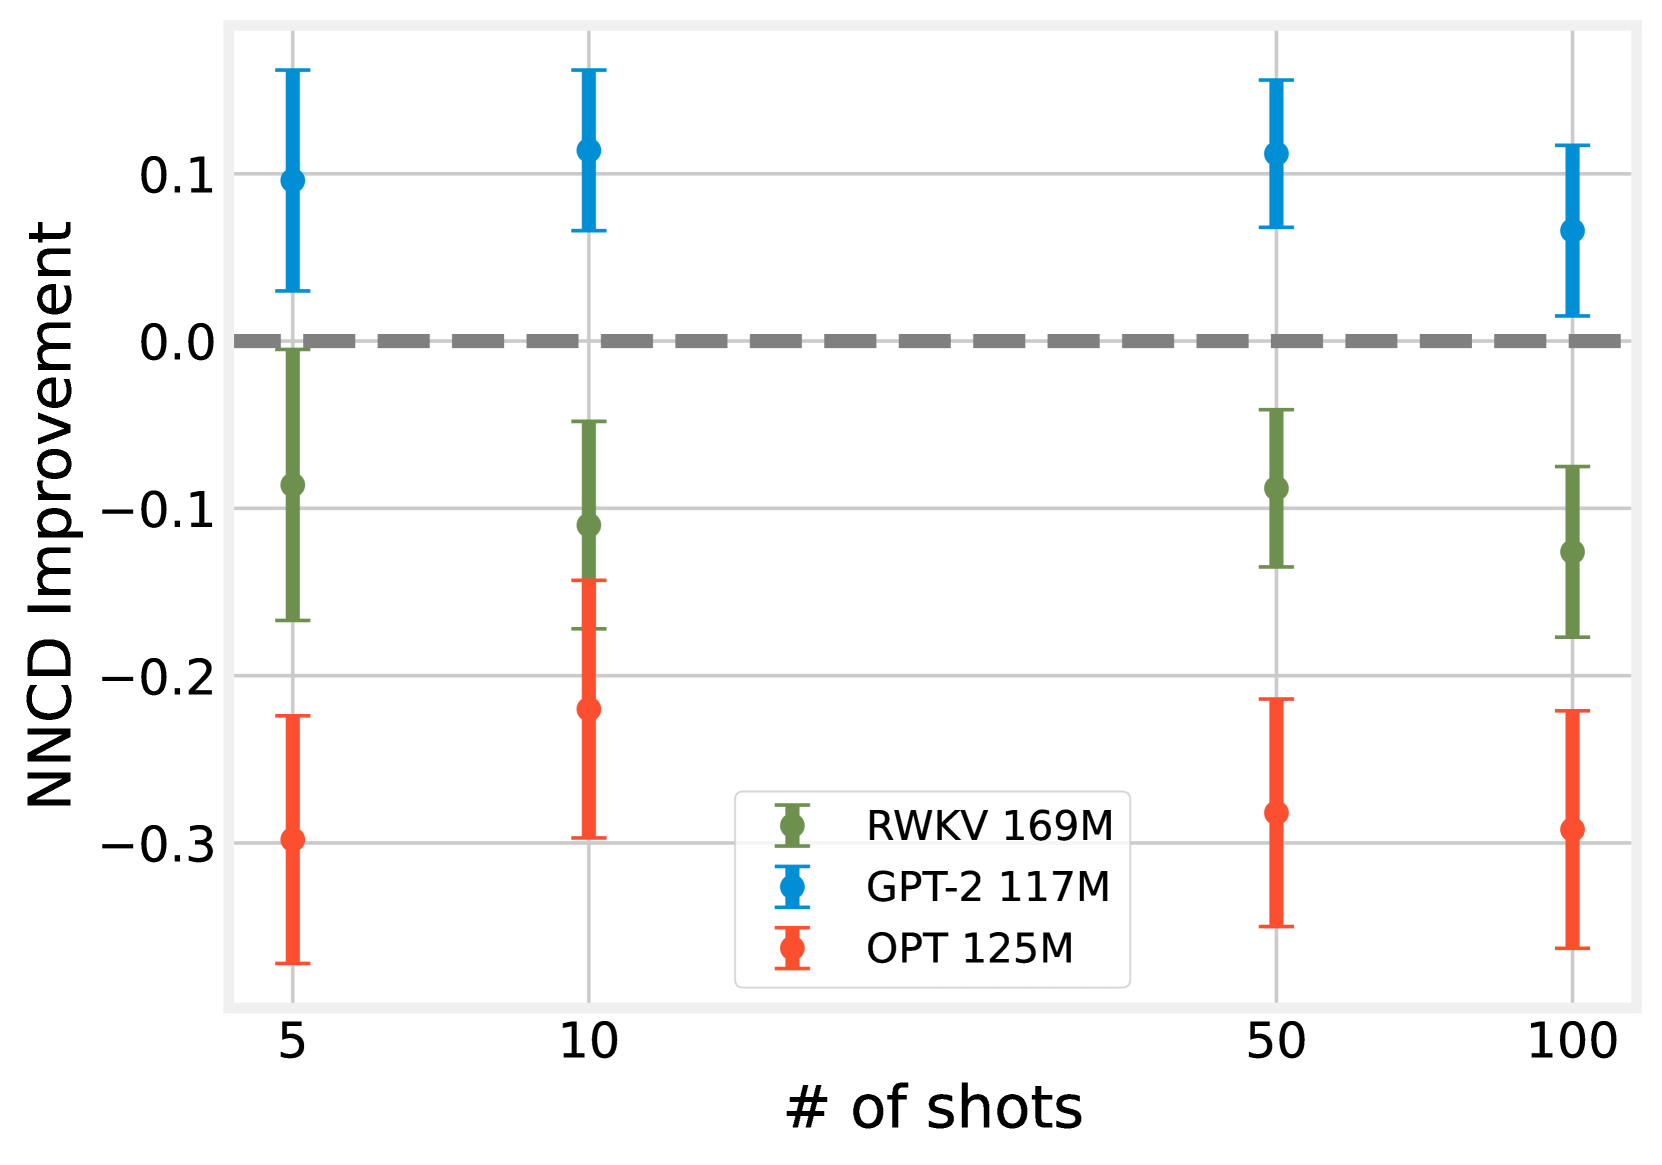
The chart compares the performance improvement of three language models (RW KV 169M, GPT-2 117M, and OPT 125M) across different numbers of training shots (5, 10, 50, 100). The y-axis measures "NNCD Improvement" (ranging from -0.3 to 0.1), with positive values indicating improvement and negative values indicating degradation. Error bars represent uncertainty in measurements.
### Components/Axes
- **X-axis**: "# of shots" (logarithmic scale: 5, 10, 50, 100)
- **Y-axis**: "NNCD Improvement" (-0.3 to 0.1, with a dashed reference line at 0.0)
- **Legend**: Located at the bottom-right, mapping colors to models:
- Green: RW KV 169M
- Blue: GPT-2 117M
- Red: OPT 125M
- **Error Bars**: Vertical lines extending from each data point to indicate measurement uncertainty.
### Detailed Analysis
1. **RW KV 169M (Green)**:
- **Trend**: Slightly worsens as shots increase.
- **Values**:
- 5 shots: -0.11 (±0.05)
- 10 shots: -0.10 (±0.08)
- 50 shots: -0.12 (±0.06)
- 100 shots: -0.13 (±0.07)
- **Error Bars**: Largest uncertainty at 10 shots (±0.08).
2. **GPT-2 117M (Blue)**:
- **Trend**: Consistently improves with more shots.
- **Values**:
- 5 shots: 0.10 (±0.06)
- 10 shots: 0.12 (±0.05)
- 50 shots: 0.13 (±0.04)
- 100 shots: 0.08 (±0.07)
- **Error Bars**: Smallest uncertainty at 50 shots (±0.04).
3. **OPT 125M (Red)**:
- **Trend**: Degrades significantly with more shots.
- **Values**:
- 5 shots: -0.30 (±0.10)
- 10 shots: -0.20 (±0.12)
- 50 shots: -0.25 (±0.08)
- 100 shots: -0.28 (±0.11)
- **Error Bars**: Largest uncertainty at 10 shots (±0.12).
### Key Observations
- **GPT-2 117M** is the only model showing improvement (positive NNCD values), with peak performance at 50 shots (0.13).
- **RW KV 169M** and **OPT 125M** exhibit degradation as shots increase, with OPT 125M showing the most severe decline (-0.30 to -0.28).
- Error bars suggest GPT-2 has more consistent results, while OPT 125M has the highest variability.
### Interpretation
The data suggests that **GPT-2 117M** benefits from increased training data (shots), likely due to its architecture or training methodology. In contrast, **RW KV 169M** and **OPT 125M** may suffer from overfitting or inefficiencies in scaling, as their performance deteriorates with more data. The error bars highlight that GPT-2’s results are more reliable, while OPT 125M’s variability raises concerns about its robustness. This could inform model selection for tasks requiring data efficiency or scalability.