TECHNICAL ASSET FINGERPRINT
b600bd208b91233e4d2c21c0
Click to view fullscreen
Press ESC or click to close
FOUND IN PAPERS
EXPERT: healer-alpha-free VERSION 1
RUNTIME: free/openrouter/healer-alpha
INTEL_VERIFIED
## Line Charts: Accuracy vs. Interactions for Three AI Models Across Three Methods
### Overview
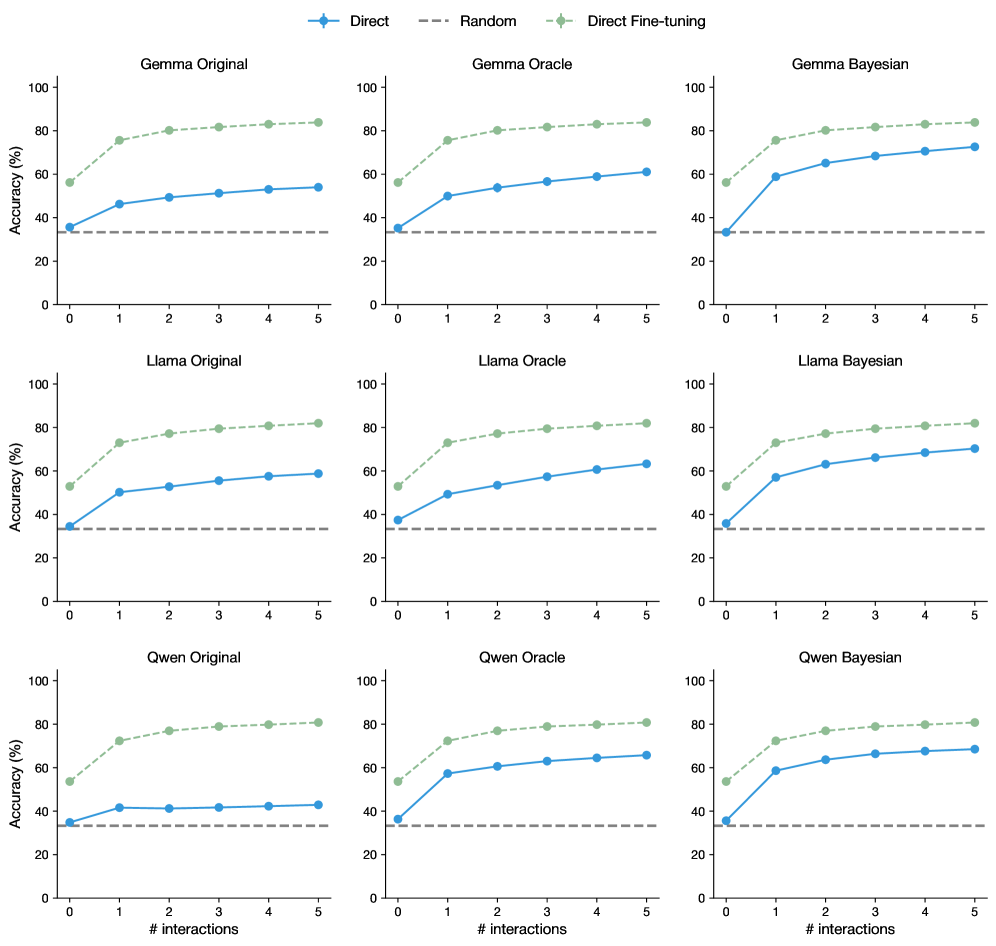
The image displays a 3x3 grid of nine line charts. Each chart plots "Accuracy (%)" against the "# interactions" (number of interactions) for a specific combination of a base AI model (Gemma, Llama, Qwen) and a training/evaluation method (Original, Oracle, Bayesian). Each chart contains three data series: "Direct," "Random," and "Direct Fine-tuning."
### Components/Axes
* **Overall Layout:** A 3x3 grid of individual line charts.
* **Common Legend:** Located at the top center of the entire image.
* **Direct:** Blue solid line with circular markers.
* **Random:** Gray dashed line.
* **Direct Fine-tuning:** Green dashed line with diamond markers.
* **Individual Chart Titles:** Each chart has a title in the format `[Model] [Method]`.
* Top Row (Left to Right): `Gemma Original`, `Gemma Oracle`, `Gemma Bayesian`
* Middle Row (Left to Right): `Llama Original`, `Llama Oracle`, `Llama Bayesian`
* Bottom Row (Left to Right): `Qwen Original`, `Qwen Oracle`, `Qwen Bayesian`
* **Axes (Identical for all charts):**
* **X-axis:** Label: `# interactions`. Ticks: 0, 1, 2, 3, 4, 5.
* **Y-axis:** Label: `Accuracy (%)`. Scale: 0 to 100, with major ticks at 0, 20, 40, 60, 80, 100.
### Detailed Analysis
Data points are approximate visual estimates from the charts.
**1. Gemma Charts (Top Row)**
* **Gemma Original:**
* *Direct Fine-tuning (Green):* Starts ~55% (0), rises steeply to ~75% (1), then gradually to ~85% (5). Trend: Sharp initial increase, then plateaus.
* *Direct (Blue):* Starts ~35% (0), rises to ~45% (1), then gradually to ~55% (5). Trend: Steady, moderate increase.
* *Random (Gray):* Flat line at ~35% across all interactions.
* **Gemma Oracle:**
* *Direct Fine-tuning (Green):* Very similar to Original: ~55% (0) to ~85% (5).
* *Direct (Blue):* Starts ~35% (0), rises to ~50% (1), then to ~60% (5). Slightly higher than Original.
* *Random (Gray):* Flat at ~35%.
* **Gemma Bayesian:**
* *Direct Fine-tuning (Green):* Similar trajectory: ~55% (0) to ~85% (5).
* *Direct (Blue):* Starts ~35% (0), rises sharply to ~60% (1), then to ~75% (5). Shows the strongest performance for the Direct method among Gemma variants.
* *Random (Gray):* Flat at ~35%.
**2. Llama Charts (Middle Row)**
* **Llama Original:**
* *Direct Fine-tuning (Green):* Starts ~55% (0), rises to ~75% (1), then to ~85% (5). Similar to Gemma.
* *Direct (Blue):* Starts ~35% (0), rises to ~50% (1), then to ~60% (5).
* *Random (Gray):* Flat at ~35%.
* **Llama Oracle:**
* *Direct Fine-tuning (Green):* Similar: ~55% (0) to ~85% (5).
* *Direct (Blue):* Starts ~35% (0), rises to ~50% (1), then to ~65% (5).
* *Random (Gray):* Flat at ~35%.
* **Llama Bayesian:**
* *Direct Fine-tuning (Green):* Similar: ~55% (0) to ~85% (5).
* *Direct (Blue):* Starts ~35% (0), rises sharply to ~60% (1), then to ~75% (5). Mirrors the Bayesian boost seen in Gemma.
* *Random (Gray):* Flat at ~35%.
**3. Qwen Charts (Bottom Row)**
* **Qwen Original:**
* *Direct Fine-tuning (Green):* Starts ~55% (0), rises to ~75% (1), then to ~85% (5).
* *Direct (Blue):* Starts ~35% (0), rises to ~40% (1), then plateaus around ~45% (5). Shows the weakest Direct method performance.
* *Random (Gray):* Flat at ~35%.
* **Qwen Oracle:**
* *Direct Fine-tuning (Green):* Similar: ~55% (0) to ~85% (5).
* *Direct (Blue):* Starts ~35% (0), rises to ~60% (1), then to ~65% (5). Significant improvement over Original.
* *Random (Gray):* Flat at ~35%.
* **Qwen Bayesian:**
* *Direct Fine-tuning (Green):* Similar: ~55% (0) to ~85% (5).
* *Direct (Blue):* Starts ~35% (0), rises sharply to ~60% (1), then to ~70% (5). Again, Bayesian method boosts Direct performance.
* *Random (Gray):* Flat at ~35%.
### Key Observations
1. **Consistent Baseline:** The "Random" baseline is a flat line at approximately 35% accuracy across all nine charts, serving as a constant reference point.
2. **Dominant Series:** "Direct Fine-tuning" (green) is consistently the highest-performing method in every chart, starting around 55% and converging near 85% accuracy by 5 interactions.
3. **Method Impact:** The "Direct" method (blue) performance varies significantly by model and method:
* It shows the lowest growth in the "Original" settings, especially for Qwen.
* It improves in "Oracle" settings.
* It shows the most dramatic improvement in "Bayesian" settings, where its trajectory becomes much steeper, especially between 0 and 1 interaction.
4. **Model Similarity:** The overall patterns are remarkably consistent across the three base models (Gemma, Llama, Qwen). The primary differentiator is the effectiveness of the "Direct" method under different training paradigms.
5. **Plateau Effect:** All improving series (Direct Fine-tuning and Direct) show a logarithmic-like growth curve: the largest gains occur between 0 and 1 interactions, with diminishing returns thereafter.
### Interpretation
This data demonstrates the significant efficacy of fine-tuning ("Direct Fine-tuning") for improving model accuracy with interaction, consistently outperforming a direct prompting approach ("Direct") across multiple base models. The "Random" baseline confirms the tasks are non-trivial.
The most insightful finding is the role of the training paradigm ("Original," "Oracle," "Bayesian") on the "Direct" method's performance. The "Bayesian" approach appears to substantially enhance the model's ability to learn from early interactions, as evidenced by the sharp initial slope of the blue line in the Bayesian charts. This suggests that Bayesian methods may be particularly effective at creating models that are more responsive to interactive feedback. The "Oracle" setting provides a moderate boost, likely representing an upper-bound or idealized training scenario.
The consistency across Gemma, Llama, and Qwen indicates these findings are robust and not specific to a single model architecture. The convergence of the "Direct Fine-tuning" series to a similar high accuracy (~85%) suggests a potential performance ceiling for this interaction-based task, regardless of the base model or the specific advanced training method used. The charts collectively argue for the value of both fine-tuning and advanced training paradigms (like Bayesian optimization) in building interactive AI systems.
DECODING INTELLIGENCE...