## Density Plot: Learned Trust ($A_\theta$)
### Overview
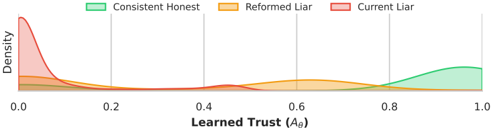
This image is a kernel density estimation (KDE) plot illustrating the distribution of "Learned Trust" (denoted as $A_\theta$) across three distinct behavioral categories: "Consistent Honest," "Reformed Liar," and "Current Liar." The x-axis represents the trust score ranging from 0.0 to 1.0, while the y-axis represents the probability density.
### Components/Axes
* **X-Axis:** Labeled "Learned Trust ($A_\theta$)". The scale is continuous from 0.0 to 1.0, with major vertical grid lines at intervals of 0.2 (0.0, 0.2, 0.4, 0.6, 0.8, 1.0).
* **Y-Axis:** Labeled "Density". This axis is unscaled, indicating relative probability density rather than absolute counts.
* **Legend:** Positioned at the top center of the chart.
* **Green Rectangle:** "Consistent Honest"
* **Orange Rectangle:** "Reformed Liar"
* **Red Rectangle:** "Current Liar"
### Detailed Analysis
The chart displays three overlapping density curves, each corresponding to a legend category.
**1. Current Liar (Red Curve)**
* **Visual Trend:** This curve exhibits a sharp, high-density spike at the extreme left (0.0). It slopes downward rapidly, approaching near-zero density by approximately 0.4 on the x-axis.
* **Data Points:** The peak density is located at approximately 0.0. The distribution is heavily left-skewed, indicating that the vast majority of "Current Liars" have a Learned Trust score very close to 0.0.
**2. Reformed Liar (Orange Curve)**
* **Visual Trend:** This curve is the most dispersed. It begins with a low-density presence near 0.0, remains relatively flat and low between 0.1 and 0.4, rises to a broad, rounded peak centered around 0.6, and then gradually tapers off toward 0.9.
* **Data Points:** The distribution is bimodal or broad-peaked, suggesting a wider variance in trust scores for this group compared to the other two. It occupies the central region of the chart (0.3 to 0.8).
**3. Consistent Honest (Green Curve)**
* **Visual Trend:** This curve is right-skewed. It begins to rise significantly around 0.7, reaches a broad peak between 0.9 and 1.0, and terminates at 1.0.
* **Data Points:** The density is concentrated at the high end of the trust spectrum, indicating that "Consistent Honest" subjects are predominantly assigned high trust scores.
### Key Observations
* **Separation:** There is a clear, distinct separation between the "Current Liar" (low trust) and "Consistent Honest" (high trust) populations.
* **Overlap:** The "Reformed Liar" category acts as a bridge between the two extremes. It shares a small amount of overlap with the "Current Liar" distribution near 0.0–0.2 and overlaps significantly with the "Consistent Honest" distribution in the 0.7–0.9 range.
* **Outliers/Anomalies:** The "Reformed Liar" group is the only one that does not have a singular, sharp peak, suggesting that "reformed" behavior is less predictable or more heterogeneous than the other two categories.
### Interpretation
This data suggests a model or evaluation system that successfully differentiates between honest and dishonest agents.
* **Discriminative Power:** The system is highly effective at identifying "Current Liars" and "Consistent Honest" agents, as evidenced by the minimal overlap between the red and green curves.
* **The "Reformed" State:** The "Reformed Liar" distribution is particularly interesting. It suggests that agents who have "reformed" do not immediately or uniformly achieve the same trust levels as "Consistent Honest" agents. Instead, they exhibit a spread of trust scores, with a significant portion achieving high trust (the peak at 0.6–0.7), but with a "long tail" extending toward lower trust values.
* **Implication:** This implies that "reformation" is a process that results in a spectrum of trust rather than a binary state. The system appears to be "cautious" regarding reformed agents, as their density peak (0.6) is lower than the peak of the "Consistent Honest" group (0.9+).