\n
## Pie Chart: Error Breakdown
### Overview
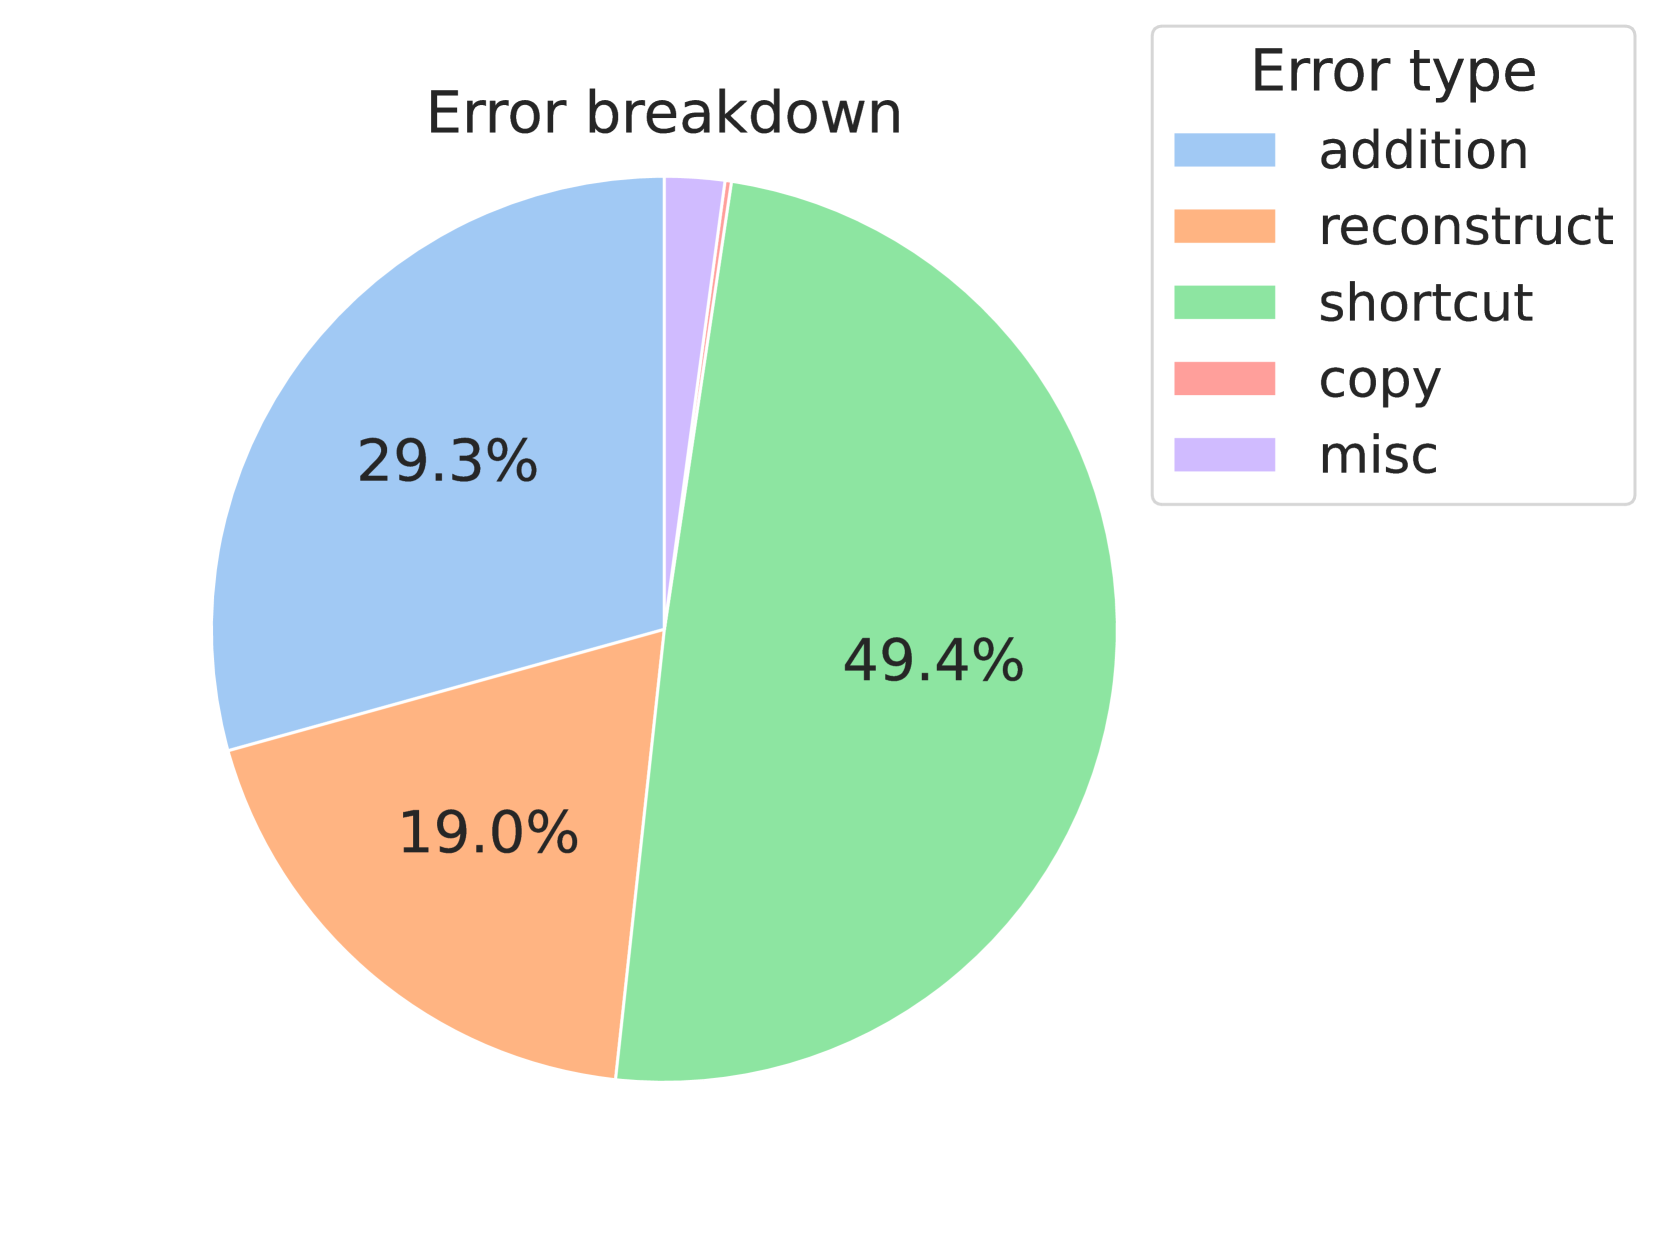
This image presents a pie chart illustrating the breakdown of different error types. The chart displays the percentage contribution of each error type to the total.
### Components/Axes
* **Title:** "Error breakdown" (positioned at the top-center of the chart)
* **Legend:** Located in the top-right corner of the chart. It maps colors to error types:
* `addition` - Light Blue
* `reconstruct` - Light Orange
* `shortcut` - Light Green
* `copy` - Light Red
* `misc` - Light Purple
* **Data Labels:** Percentage values are displayed within each slice of the pie chart.
### Detailed Analysis
The pie chart segments represent the following error types and their corresponding percentages:
* **addition:** 29.3% (Light Blue slice)
* **reconstruct:** 19.0% (Light Orange slice)
* **shortcut:** 49.4% (Light Green slice) - This is the largest segment, representing almost half of all errors.
* **copy:** A very small segment, approximately 1.3% (Light Red slice)
* **misc:** A very small segment, approximately 1.0% (Light Purple slice)
The slices are arranged clockwise, starting with "addition" at the top. The "shortcut" slice occupies the largest portion of the pie, followed by "addition" and then "reconstruct". The "copy" and "misc" slices are very small and positioned near the top-right of the chart.
### Key Observations
* "Shortcut" errors are the most frequent, accounting for nearly half (49.4%) of all errors.
* "Addition" errors represent a significant portion of the total (29.3%).
* "Reconstruct" errors account for 19.0% of the total.
* "Copy" and "misc" errors are relatively rare, each contributing less than 2% to the total.
### Interpretation
The data suggests that errors related to "shortcuts" are the primary source of issues. This could indicate problems with the implementation of shortcut functionality, user confusion regarding shortcuts, or a high reliance on shortcuts that are prone to errors. The substantial proportion of "addition" errors also warrants investigation. It might be beneficial to analyze the specific scenarios where these errors occur to identify underlying causes and implement targeted improvements. The small percentages of "copy" and "misc" errors suggest they are less critical areas for immediate attention, but should still be monitored. The chart provides a clear prioritization for error resolution efforts, focusing on "shortcut" and "addition" related issues first.