## Chart: K-shot Regression Performance
### Overview
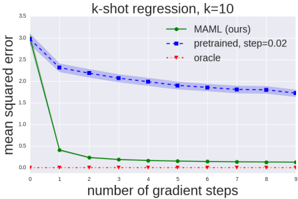
The image is a line chart comparing the performance of three different regression models: MAML (ours), a pretrained model, and an oracle model. The chart plots the mean squared error against the number of gradient steps.
### Components/Axes
* **Title:** k-shot regression, k=10
* **X-axis:** number of gradient steps (values from 0 to 9)
* **Y-axis:** mean squared error (values from 0.0 to 3.5)
* **Legend:**
* **Green line with circle markers:** MAML (ours)
* **Blue dashed line with square markers:** pretrained, step=0.02
* **Red dotted line with triangle markers:** oracle
### Detailed Analysis
* **MAML (ours) - Green Line:** The green line starts at approximately 3.0 and rapidly decreases to around 0.4 at step 1. It then continues to decrease gradually, reaching a value of approximately 0.1 at step 9.
* Step 0: ~3.0
* Step 1: ~0.4
* Step 2: ~0.25
* Step 3: ~0.2
* Step 4: ~0.17
* Step 5: ~0.15
* Step 6: ~0.14
* Step 7: ~0.13
* Step 8: ~0.12
* Step 9: ~0.11
* **Pretrained, step=0.02 - Blue Line:** The blue dashed line starts at approximately 3.0 and gradually decreases over the gradient steps. There is a shaded blue area around the line, indicating the uncertainty or variance.
* Step 0: ~3.0
* Step 1: ~2.3
* Step 2: ~2.1
* Step 3: ~2.05
* Step 4: ~1.95
* Step 5: ~1.9
* Step 6: ~1.85
* Step 7: ~1.8
* Step 8: ~1.78
* Step 9: ~1.7
* **Oracle - Red Line:** The red dotted line remains close to 0.0 throughout all gradient steps.
* Step 0: ~0.05
* Step 1: ~0.02
* Step 2: ~0.01
* Step 3: ~0.01
* Step 4: ~0.01
* Step 5: ~0.01
* Step 6: ~0.01
* Step 7: ~0.01
* Step 8: ~0.01
* Step 9: ~0.01
### Key Observations
* The MAML model shows a significant initial drop in mean squared error, indicating rapid learning.
* The pretrained model decreases more slowly than the MAML model.
* The oracle model consistently has the lowest mean squared error, representing the ideal performance.
### Interpretation
The chart demonstrates that the MAML model (ours) achieves a lower mean squared error compared to the pretrained model, especially in the initial gradient steps. The oracle model serves as a benchmark, showing the lowest possible error. The MAML model's rapid initial learning suggests it is more effective at adapting to the task compared to the pretrained model. The shaded area around the "pretrained" line indicates the variance in the model's performance. The oracle model's consistently low error indicates it has perfect knowledge of the task.