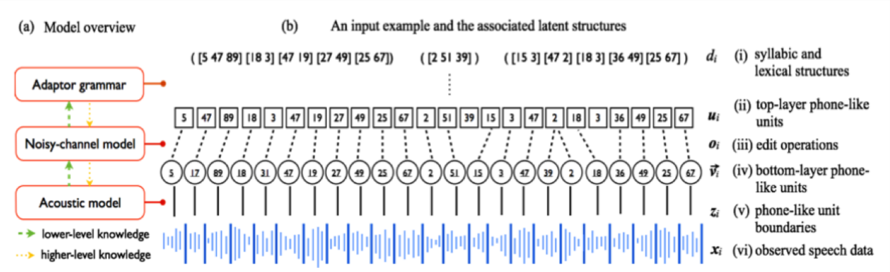
## Diagram: Model Overview and Input Example with Latent Structures
### Overview
The image presents a diagram illustrating a model overview and an input example with associated latent structures. The diagram consists of two main parts: (a) a block diagram representing the model architecture, and (b) a visualization of an input example and its corresponding latent structures. The diagram uses arrows to indicate the flow of information and the levels of knowledge.
### Components/Axes
The diagram includes the following components:
* **Model Overview (a):**
* Adaptor grammar (rectangle)
* Noisy-channel model (rectangle)
* Acoustic model (rectangle)
* Arrows indicating lower-level knowledge (dashed green arrows)
* Arrows indicating higher-level knowledge (solid yellow arrows)
* **Input Example and Latent Structures (b):**
* Observed speech data (xₜ) - represented as a waveform
* Phone-like unit boundaries (zₜ) - a series of numbers above the waveform
* Lower-layer phone-like units (vₜ) - a series of numbers above zₜ
* Edit operations (θₜ) - a series of numbers above vₜ
* Top-layer phone-like units (μₜ) - a series of numbers above θₜ
* Syllabic and lexical structures (dₜ) - a series of numbers above μₜ
* **Labels:**
* (a) Model overview
* (b) An input example and the associated latent structures
* xₜ: (vi) observed speech data
* zₜ: (v) phone-like unit boundaries
* vₜ: (iv) lower-layer phone-like units
* θₜ: (iii) edit operations
* μₜ: (ii) top-layer phone-like units
* dₜ: (i) syllabic and lexical structures
* **Numerical Data:**
* Observed speech data (xₜ): A complex waveform, no specific values are discernible.
* Phone-like unit boundaries (zₜ): 5, 47, 89, 18, 3, 47, 19, 27, 49, 25, 67
* Lower-layer phone-like units (vₜ): 5, 17, 18, 11, 12, 19, 22, 25, 47, 42, 51, 15, 3, 32, 39, 22, 18, 36, 49, 25, 67
* Edit operations (θₜ): 15, 3, 11, 47, 2, 18, 3, 36, 49, 25, 67
* Top-layer phone-like units (μₜ): 39, 15, 3, 47, 2, 39
* Syllabic and lexical structures (dₜ): 5, 47, 89, 18, 3, 47, 19, 27, 49, 25, 67
### Detailed Analysis or Content Details
The model overview (a) shows a hierarchical structure with the acoustic model at the bottom, the noisy-channel model in the middle, and the adaptor grammar at the top. The acoustic model receives lower-level knowledge, while the adaptor grammar receives higher-level knowledge. The noisy-channel model acts as an intermediary, receiving input from both the acoustic model and the adaptor grammar.
The input example (b) demonstrates how observed speech data (xₜ) is transformed into a series of latent structures. The observed speech data is represented as a waveform. Above the waveform are the phone-like unit boundaries (zₜ), followed by the lower-layer phone-like units (vₜ), edit operations (θₜ), top-layer phone-like units (μₜ), and finally, the syllabic and lexical structures (dₜ). The numbers associated with each layer represent the corresponding latent units. The arrows indicate the flow of information from the lower layers to the higher layers.
### Key Observations
The diagram illustrates a hierarchical model for speech recognition or processing. The model uses a series of latent structures to represent the input speech data at different levels of abstraction. The use of both lower-level and higher-level knowledge suggests a combination of acoustic and linguistic information is used in the model. The numerical data in the input example provides a concrete illustration of how the model processes speech data.
### Interpretation
The diagram depicts a probabilistic model for speech recognition, likely based on Hidden Markov Models (HMMs) or a related framework. The "noisy-channel model" suggests a Bayesian approach where the observed speech data is considered a noisy version of the underlying linguistic structure. The adaptor grammar likely allows for customization or adaptation of the model to specific speakers or domains. The latent structures represent the hidden states of the model, which are inferred from the observed speech data. The hierarchical structure allows the model to capture both the acoustic and linguistic properties of speech. The diagram suggests a bottom-up approach to speech recognition, starting with the acoustic signal and gradually building up to the syllabic and lexical levels. The numerical data in the input example provides a snapshot of the model's internal representation of a particular utterance. The diagram is a conceptual illustration of the model's architecture and does not provide specific details about the model's parameters or training procedure.