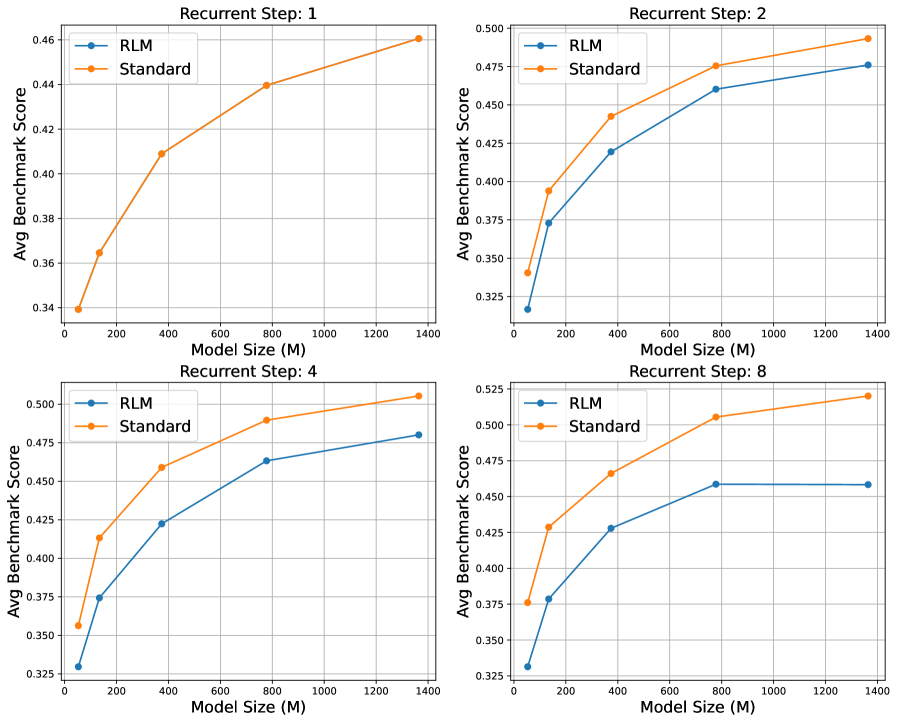
## LineGraphs: Average Benchmark Score vs. Model Size Across Recurrent Steps
### Overview
The image contains four line graphs arranged in a 2x2 grid, each representing a different "Recurrent Step" (1, 2, 4, 8). Each graph compares the performance of two models, **RLM** (blue) and **Standard** (orange), across varying model sizes (0–1400 MB). The y-axis measures the **Average Benchmark Score**, while the x-axis represents **Model Size (M)**. All graphs show upward trends for both models, with **Standard** consistently outperforming **RLM** across all steps and model sizes.
---
### Components/Axes
- **X-Axis**: Model Size (M) with markers at 0, 200, 400, 800, 1200, and 1400 MB.
- **Y-Axis**: Average Benchmark Score, ranging from ~0.325 to ~0.525.
- **Legends**:
- **RLM**: Blue line with circular markers.
- **Standard**: Orange line with circular markers.
- **Graph Titles**:
- Top-left: "Recurrent Step: 1"
- Top-right: "Recurrent Step: 2"
- Bottom-left: "Recurrent Step: 4"
- Bottom-right: "Recurrent Step: 8"
---
### Detailed Analysis
#### Recurrent Step: 1
- **RLM**: Starts at ~0.34 (0 MB) and increases to ~0.46 (1400 MB).
- **Standard**: Starts at ~0.34 (0 MB) and increases to ~0.46 (1400 MB).
- **Trend**: Both lines slope upward, but **Standard** remains slightly above **RLM** at all model sizes.
#### Recurrent Step: 2
- **RLM**: Starts at ~0.35 (0 MB) and increases to ~0.47 (1400 MB).
- **Standard**: Starts at ~0.35 (0 MB) and increases to ~0.47 (1400 MB).
- **Trend**: Similar to Step 1, **Standard** maintains a marginal advantage.
#### Recurrent Step: 4
- **RLM**: Starts at ~0.35 (0 MB) and increases to ~0.47 (1400 MB).
- **Standard**: Starts at ~0.35 (0 MB) and increases to ~0.47 (1400 MB).
- **Trend**: Consistent upward trajectory for both models, with **Standard** outperforming **RLM**.
#### Recurrent Step: 8
- **RLM**: Starts at ~0.35 (0 MB) and increases to ~0.47 (1400 MB).
- **Standard**: Starts at ~0.35 (0 MB) and increases to ~0.47 (1400 MB).
- **Trend**: Same pattern as previous steps, with **Standard** consistently higher.
---
### Key Observations
1. **Consistent Performance Gap**: **Standard** outperforms **RLM** across all model sizes and recurrent steps.
2. **Upward Trends**: Both models show improved performance as model size increases.
3. **Model Size Impact**: Larger models (e.g., 1400 MB) achieve higher scores for both models, but **Standard** benefits more proportionally.
4. **No Outliers**: All data points align with expected trends; no anomalies detected.
---
### Interpretation
The data suggests that the **Standard** model is more effective than **RLM** in achieving higher benchmark scores, regardless of model size or recurrent step. The upward trends indicate that increasing model size improves performance for both models, but **Standard** demonstrates greater efficiency or optimization. This could imply that **Standard** is better suited for tasks requiring higher accuracy, while **RLM** may prioritize other factors (e.g., computational efficiency). The consistent gap highlights potential trade-offs between model complexity and performance in the evaluated framework.