## Line Chart: Accuracy vs. Sample Size
### Overview
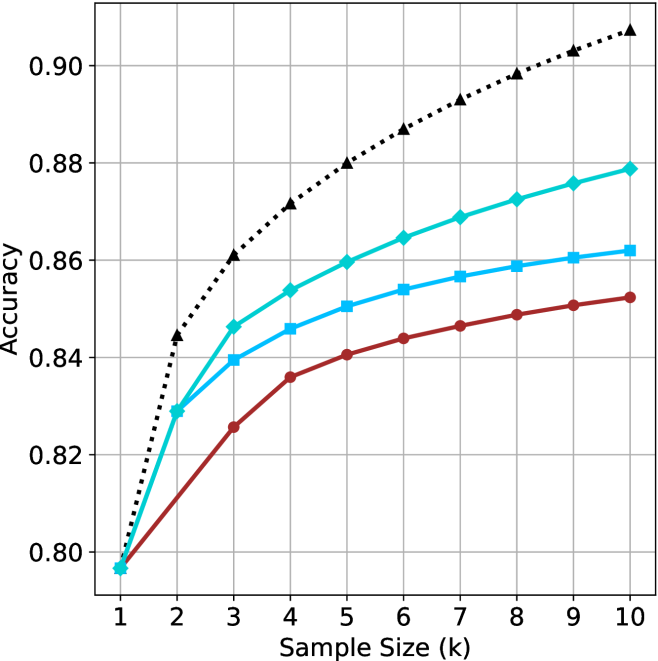
The image is a line chart showing the relationship between "Sample Size (k)" on the x-axis and "Accuracy" on the y-axis for four different data series. The chart displays how accuracy changes as the sample size increases.
### Components/Axes
* **X-axis:** "Sample Size (k)" with tick marks at integers from 1 to 10.
* **Y-axis:** "Accuracy" with tick marks at 0.80, 0.82, 0.84, 0.86, 0.88, and 0.90.
* **Gridlines:** Present for both x and y axes.
* **Data Series:** Four distinct lines, each representing a different condition or model. The legend is missing, so the exact meaning of each line is unknown. The lines are distinguished by color and marker style.
### Detailed Analysis
Here's a breakdown of each data series:
1. **Black Dotted Line with Triangle Markers:** This line shows the highest accuracy overall.
* At Sample Size 1, Accuracy is approximately 0.80.
* At Sample Size 2, Accuracy is approximately 0.845.
* At Sample Size 3, Accuracy is approximately 0.86.
* At Sample Size 4, Accuracy is approximately 0.87.
* At Sample Size 5, Accuracy is approximately 0.878.
* At Sample Size 6, Accuracy is approximately 0.885.
* At Sample Size 7, Accuracy is approximately 0.89.
* At Sample Size 8, Accuracy is approximately 0.895.
* At Sample Size 9, Accuracy is approximately 0.90.
* At Sample Size 10, Accuracy is approximately 0.905.
* **Trend:** The line slopes upward, indicating increasing accuracy with larger sample sizes. The rate of increase slows down as the sample size increases.
2. **Light Blue Line with Diamond Markers:** This line shows the second-highest accuracy.
* At Sample Size 1, Accuracy is approximately 0.795.
* At Sample Size 2, Accuracy is approximately 0.83.
* At Sample Size 3, Accuracy is approximately 0.845.
* At Sample Size 4, Accuracy is approximately 0.855.
* At Sample Size 5, Accuracy is approximately 0.86.
* At Sample Size 6, Accuracy is approximately 0.865.
* At Sample Size 7, Accuracy is approximately 0.87.
* At Sample Size 8, Accuracy is approximately 0.873.
* At Sample Size 9, Accuracy is approximately 0.876.
* At Sample Size 10, Accuracy is approximately 0.878.
* **Trend:** The line slopes upward, indicating increasing accuracy with larger sample sizes. The rate of increase slows down as the sample size increases.
3. **Blue Line with Square Markers:** This line shows the third-highest accuracy.
* At Sample Size 1, Accuracy is approximately 0.795.
* At Sample Size 2, Accuracy is approximately 0.82.
* At Sample Size 3, Accuracy is approximately 0.84.
* At Sample Size 4, Accuracy is approximately 0.85.
* At Sample Size 5, Accuracy is approximately 0.855.
* At Sample Size 6, Accuracy is approximately 0.857.
* At Sample Size 7, Accuracy is approximately 0.859.
* At Sample Size 8, Accuracy is approximately 0.86.
* At Sample Size 9, Accuracy is approximately 0.861.
* At Sample Size 10, Accuracy is approximately 0.862.
* **Trend:** The line slopes upward, indicating increasing accuracy with larger sample sizes. The rate of increase slows down as the sample size increases.
4. **Brown Line with Circle Markers:** This line shows the lowest accuracy.
* At Sample Size 1, Accuracy is approximately 0.795.
* At Sample Size 2, Accuracy is approximately 0.81.
* At Sample Size 3, Accuracy is approximately 0.825.
* At Sample Size 4, Accuracy is approximately 0.835.
* At Sample Size 5, Accuracy is approximately 0.84.
* At Sample Size 6, Accuracy is approximately 0.845.
* At Sample Size 7, Accuracy is approximately 0.847.
* At Sample Size 8, Accuracy is approximately 0.849.
* At Sample Size 9, Accuracy is approximately 0.851.
* At Sample Size 10, Accuracy is approximately 0.852.
* **Trend:** The line slopes upward, indicating increasing accuracy with larger sample sizes. The rate of increase slows down as the sample size increases.
### Key Observations
* All four data series show an increase in accuracy as the sample size increases.
* The rate of increase in accuracy diminishes as the sample size grows larger for all series.
* The black dotted line consistently outperforms the other three in terms of accuracy.
* The brown line consistently shows the lowest accuracy among the four.
### Interpretation
The chart suggests that increasing the sample size generally improves the accuracy of whatever is being measured. However, the diminishing returns indicate that there's a point beyond which increasing the sample size yields only marginal improvements in accuracy. The different lines likely represent different models or conditions, with the black dotted line representing the most effective one in terms of achieving high accuracy with increasing sample sizes. Without a legend, the specific meaning of each line remains unclear, but the chart clearly demonstrates the relationship between sample size and accuracy for these four distinct scenarios.