## Line Chart: Average Accuracy by Rank for Different Dataset Sizes
### Overview
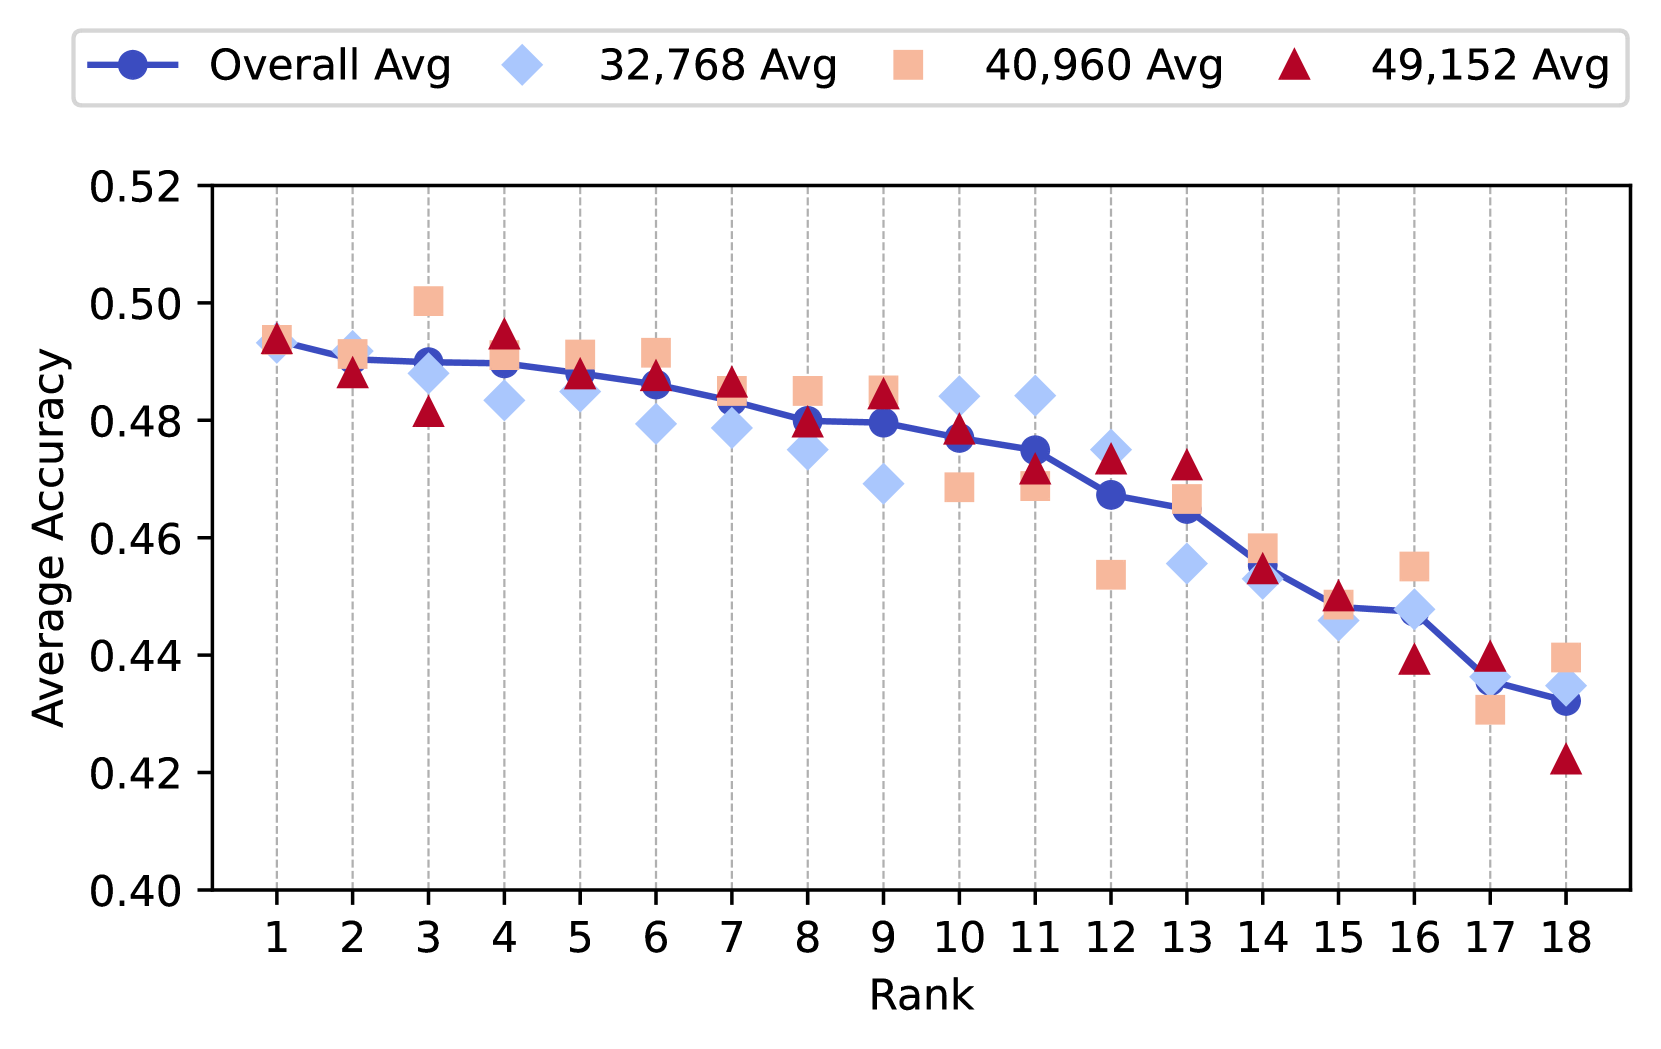
The image displays a line chart comparing the average accuracy across 18 ranks for four different categories: an overall average and three specific dataset sizes (32,768, 40,960, and 49,152). The chart illustrates a general downward trend in accuracy as the rank increases from 1 to 18.
### Components/Axes
* **Chart Type:** Line chart with multiple data series, each distinguished by a unique marker shape and color.
* **X-Axis:** Labeled "Rank". It has discrete integer markers from 1 to 18.
* **Y-Axis:** Labeled "Average Accuracy". It is a continuous scale ranging from 0.40 to 0.52, with major gridlines at intervals of 0.02.
* **Legend:** Positioned at the top center of the chart. It defines four data series:
* **Overall Avg:** Represented by a solid blue line with circular markers.
* **32,768 Avg:** Represented by light blue diamond markers.
* **40,960 Avg:** Represented by peach-colored square markers.
* **49,152 Avg:** Represented by red triangle markers.
* **Grid:** Vertical dashed gridlines are present for each rank on the x-axis.
### Detailed Analysis
**Trend Verification:** All four data series exhibit a general downward trend from left (Rank 1) to right (Rank 18). The "Overall Avg" line shows the smoothest decline. The other series show more point-to-point variability but follow the same overall direction.
**Data Point Extraction (Approximate Values):**
The following table reconstructs the approximate y-values (Average Accuracy) for each series at each rank. Values are estimated based on visual alignment with the y-axis grid.
| Rank | Overall Avg (Blue Circle) | 32,768 Avg (Light Blue Diamond) | 40,960 Avg (Peach Square) | 49,152 Avg (Red Triangle) |
| :--- | :--- | :--- | :--- | :--- |
| 1 | 0.495 | 0.495 | 0.495 | 0.495 |
| 2 | 0.492 | 0.492 | 0.492 | 0.488 |
| 3 | 0.490 | 0.488 | **0.500** | 0.482 |
| 4 | 0.490 | 0.484 | 0.492 | 0.495 |
| 5 | 0.488 | 0.485 | 0.492 | 0.488 |
| 6 | 0.486 | 0.480 | 0.492 | 0.488 |
| 7 | 0.484 | 0.480 | 0.485 | 0.486 |
| 8 | 0.480 | 0.475 | 0.486 | 0.480 |
| 9 | 0.480 | 0.470 | 0.485 | 0.485 |
| 10 | 0.478 | 0.485 | 0.468 | 0.478 |
| 11 | 0.475 | 0.485 | 0.468 | 0.472 |
| 12 | 0.468 | 0.475 | **0.454** | 0.474 |
| 13 | 0.465 | 0.455 | 0.468 | 0.472 |
| 14 | 0.455 | 0.454 | 0.458 | 0.455 |
| 15 | 0.448 | 0.445 | 0.448 | 0.450 |
| 16 | 0.448 | 0.448 | 0.455 | 0.438 |
| 17 | 0.435 | 0.435 | 0.430 | 0.440 |
| 18 | 0.432 | 0.435 | 0.440 | **0.422** |
**Key Observations:**
1. **Convergence at Start:** At Rank 1, all four series start at approximately the same accuracy value (~0.495).
2. **Peak and Trough Values:** The highest single data point is for the "40,960 Avg" series at Rank 3 (~0.500). The lowest single data point is for the "49,152 Avg" series at Rank 18 (~0.422).
3. **Series Behavior:**
* The **"Overall Avg"** line acts as a central trend, smoothing the variability of the individual series.
* The **"40,960 Avg"** series shows the most volatility, with a notable peak at Rank 3 and a significant dip at Rank 12.
* The **"49,152 Avg"** series often performs at or above the overall average until the final ranks (16-18), where it drops sharply.
* The **"32,768 Avg"** series frequently falls below the overall average line, particularly in the middle ranks (6-9).
4. **Final Rank Divergence:** At Rank 18, the series show their greatest spread, with "40,960 Avg" (~0.440) performing best and "49,152 Avg" (~0.422) performing worst.
### Interpretation
The chart demonstrates a clear negative correlation between rank and average accuracy across all tested conditions. This suggests that as the ranking metric increases (the meaning of "Rank" is not specified, but it could represent model size, complexity, or another ordinal variable), the system's average accuracy tends to decrease.
The relationship between dataset size (32K, 40K, 49K) and performance is not linear. The largest dataset (49,152) does not consistently yield the highest accuracy; it is competitive in early to mid-ranks but suffers the steepest decline at the end. The 40,960 dataset shows the highest peak performance but is also prone to significant drops. This indicates that factors beyond raw dataset size—such as data quality, composition, or interaction with the model at different ranks—are likely influencing the results. The "Overall Avg" line provides a reliable summary of the general trend, masking the important variability present in the individual conditions.