## Diagram: Input-Output Grid Transformation
### Overview
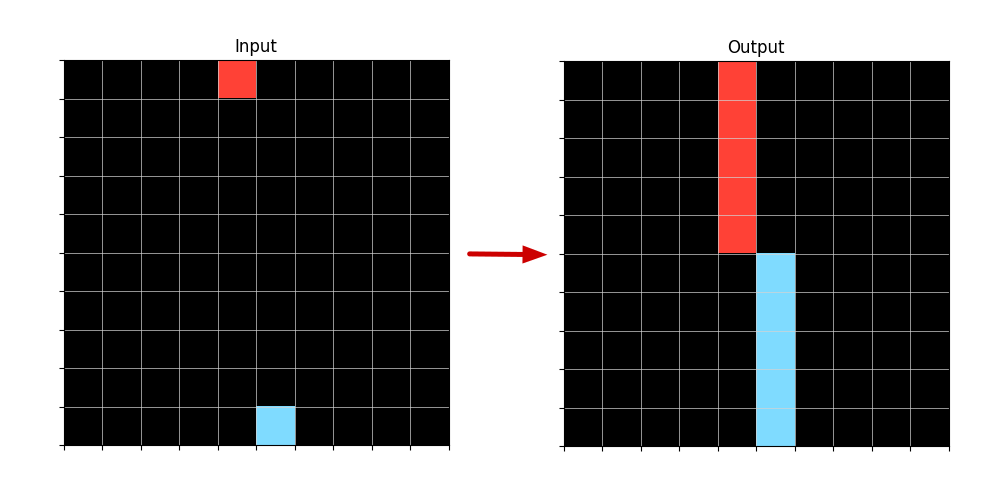
The image displays a technical diagram illustrating a transformation process between two 10x10 grids. The left grid is labeled "Input" and contains two isolated colored cells on a black background. The right grid, labeled "Output," shows the result of a transformation where those colored cells have been extended into vertical bars. A red arrow points from the input to the output, indicating the direction of the process.
### Components/Axes
* **Structure:** Two identical 10x10 grids, each composed of 100 square cells defined by thin, light gray grid lines on a black background.
* **Labels:**
* The left grid has the title "Input" centered above it.
* The right grid has the title "Output" centered above it.
* **Visual Elements:**
* **Input Grid:** Contains two single, filled cells.
* One cell is filled with a solid **red** color.
* One cell is filled with a solid **light blue** color.
* **Output Grid:** Contains two vertical bars, each spanning multiple cells.
* One bar is filled with the same **red** color.
* One bar is filled with the same **light blue** color.
* **Arrow:** A solid **red** arrow is positioned between the two grids, pointing from the "Input" grid to the "Output" grid.
### Detailed Analysis
**1. Input Grid (Left) - Component Isolation:**
* **Red Cell:** Located in the **top row (Row 1)**, **column 5** (counting from left to right). It is a single, isolated cell.
* **Blue Cell:** Located in the **bottom row (Row 10)**, **column 6**. It is also a single, isolated cell.
* All other 98 cells in the grid are black (empty).
**2. Output Grid (Right) - Component Isolation:**
* **Red Bar:** A vertical bar occupying **Rows 1 through 5** in **column 5**. It is 5 cells tall.
* **Blue Bar:** A vertical bar occupying **Rows 6 through 10** in **column 6**. It is 5 cells tall.
* The bars are contiguous and directly adjacent where they meet (Row 5, Col 5 and Row 6, Col 6 are diagonally adjacent).
* All other 90 cells in the grid are black (empty).
**3. Transformation Flow:**
The red arrow explicitly defines the relationship: the state on the left ("Input") is processed to produce the state on the right ("Output").
### Key Observations
* **Spatial Relationship:** The output bars originate from the exact column positions of their corresponding input cells. The red bar is in the same column (5) as the red input cell. The blue bar is in the same column (6) as the blue input cell.
* **Vertical Expansion:** The transformation converts a single cell into a vertical bar of length 5.
* **Directional Logic:** The expansion appears to follow a directional rule from the input point:
* The **red** input cell at the **top** expands **downward** to form its bar.
* The **blue** input cell at the **bottom** expands **upward** to form its bar.
* **Non-Overlap:** The two output bars do not overlap in cells. They meet at a diagonal boundary between (Row5, Col5) and (Row6, Col6).
### Interpretation
This diagram visually encodes a specific data transformation or image processing operation. It demonstrates a rule-based mapping where isolated data points (the input cells) are used as seeds to generate extended features (the output bars).
The process suggests a form of **vertical dilation** or **feature propagation** with a fixed kernel size (5 pixels/cells). The direction of propagation (downward from top, upward from bottom) implies the operation is context-aware, possibly using the cell's position within the grid to determine the expansion direction. This could represent operations in computer vision (like morphological dilation with a directional structuring element), data visualization (expanding a point into a timeline or bar), or a simple algorithm for filling space from a starting point.
The clear separation of the two bars in the output indicates the transformation is applied independently to each input seed. The diagram effectively communicates a "before-and-after" state, making the transformation rule intuitive: **"Take each colored point and draw a 5-cell vertical line from it, extending towards the center of the grid."**